Table of Contents
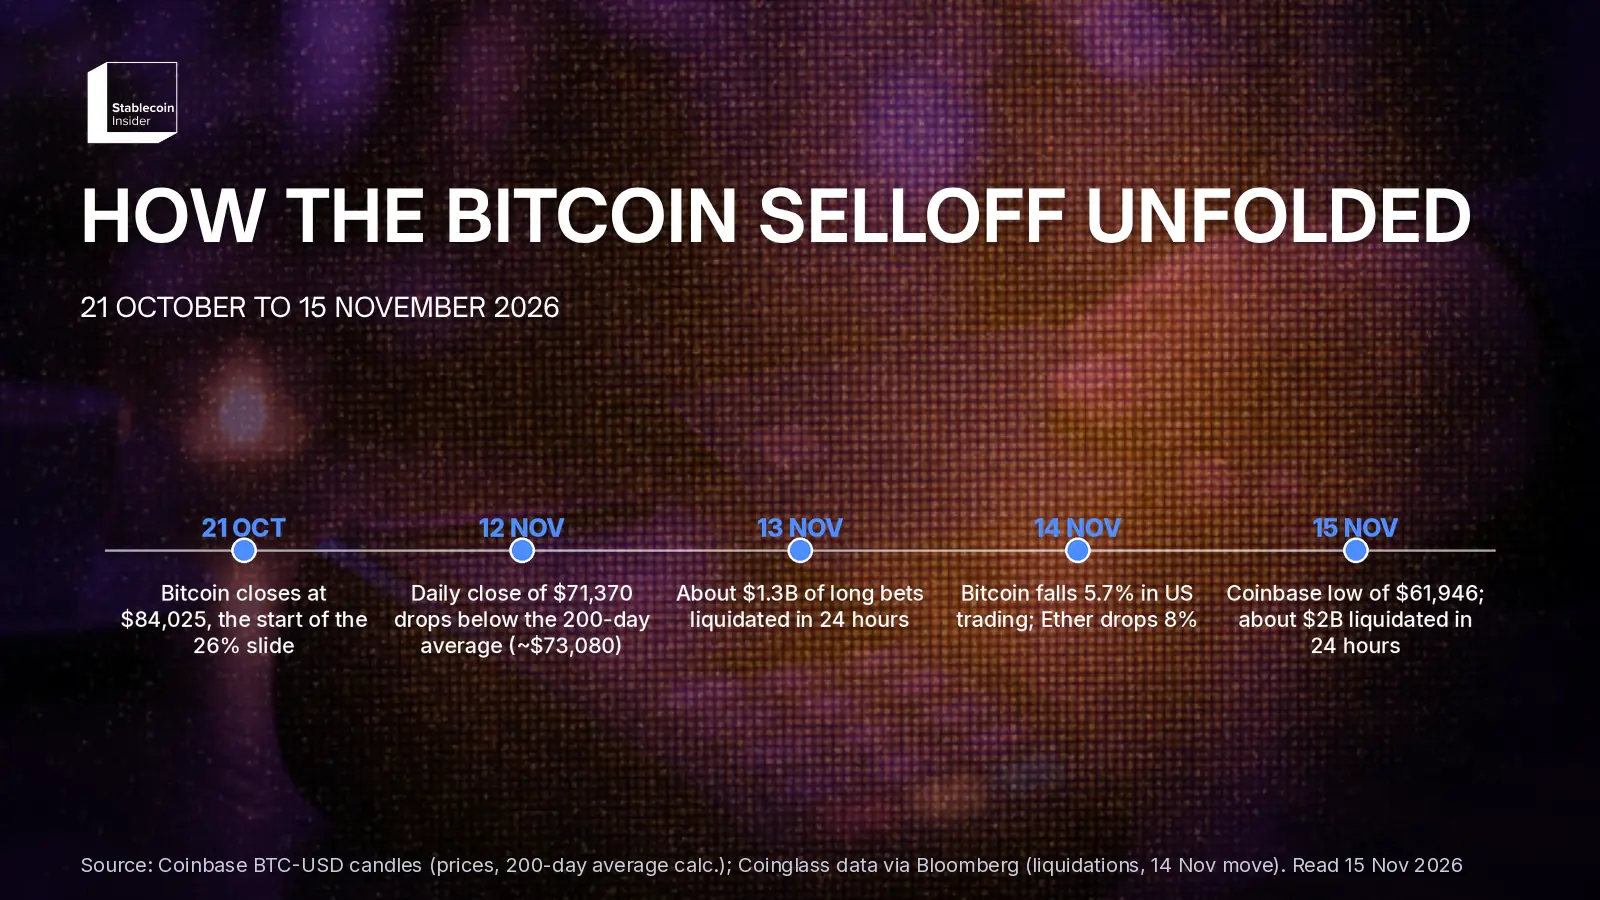
Bitcoin fell to a four-month low early on Sunday, 15 November 2026, trading as low as $61,946 on Coinbase between 02:00 and 03:00 CET, according to Coinbase Exchange's public price data. Bloomberg put the low at $62,112, its weakest level since 14 July, as leveraged long positions were forced shut (Bloomberg via The Straits Times).
About $2 billion of crypto positions were liquidated in the 24 hours to 07:00 Singapore time (00:00 CET) on 15 November, including $774 million in Bitcoin and $488 million in Ether, Bloomberg reported, citing Coinglass data. Bitcoin had partly recovered to $64,410 on Coinbase by 08:14 CET.
Key Takeaways
- Coinbase BTC-USD hit $61,946 overnight, 26.3% below its 21 October close of $84,025 and 7.3% above the 2026 low of $57,718 set on 1 July.
- Bitcoin closed below its 200-day average on 12 November for the first time since 18 August, in our calculation from Coinbase daily closes. The average stood at about $72,970 on 14 November.
- Coinglass data cited by Bloomberg show about $2 billion of liquidations in 24 hours, mostly long positions, after about $1.3 billion on 13 November.
- Ether fell to $1,709 on Coinbase, its lowest since early July and 30.8% below its 21 October close.
- Total crypto market value was $2.21 trillion at 08:07 CET, down 6.7% in 24 hours, according to CoinGecko.
How low did Bitcoin fall on 15 November?
Bitcoin fell as low as $61,946.17 on Coinbase on 15 November, in the hourly candle that opened at 02:00 CET (Coinbase candles). Coinbase daily data last showed a lower print on 13 July. Bloomberg, using its own pricing, recorded $62,112 and called it the weakest since 14 July; Investing.com reported the same $62,112 low (Investing.com).
The table lists the levels that frame the move. Rows link to the source each figure was read from.
| Level | Price (US$) | Date or time | Source |
|---|---|---|---|
| Intraday low, Coinbase | 61,946 | 15 Nov, 02:00–03:00 CET | Coinbase candles |
| Intraday low, Bloomberg | 62,112 | 15 Nov, Asian trading | Bloomberg |
| Price when this was written | 64,410 | 15 Nov, 08:14 CET | Coinbase |
| 200-day average of daily closes | ~72,970 | Through 14 Nov | Our calculation, Coinbase data |
| 21 October daily close | 84,025 | 21 Oct | Coinbase candles |
| 2026 low, Coinbase | 57,718 | 1 Jul | Coinbase candles |
Two things stand out. The overnight low erased 26.3% from the 21 October close, in line with the "about 25%" decline Bloomberg described. And the price is still 7.3% above the July low, so this is the weakest level in four months, not a new 2026 low. Glassnode has flagged a concentration of potential liquidations between $59,500 and $62,600, Investing.com reported, and Sunday's low sat inside that band (Investing.com).
Why does the 200-day average matter here?
The 200-day average matters here because traders named it as the trigger for the latest wave of selling. "I think this is a technical move, as Bitcoin broke down through its 200-day moving average of about US$73,000, which has caused a slew of liquidations and new shorts to develop," Rich Rosenblum, co-founder of market maker GSR, told Bloomberg (Bloomberg).
Our own calculation from Coinbase daily closes matches his level. The 200-day simple average was $73,080 on 12 November, the day Bitcoin closed at $71,370, its first close below the line since 18 August. Bitcoin then closed at $68,237 on 13 November and $64,119 on 14 November (UTC days).
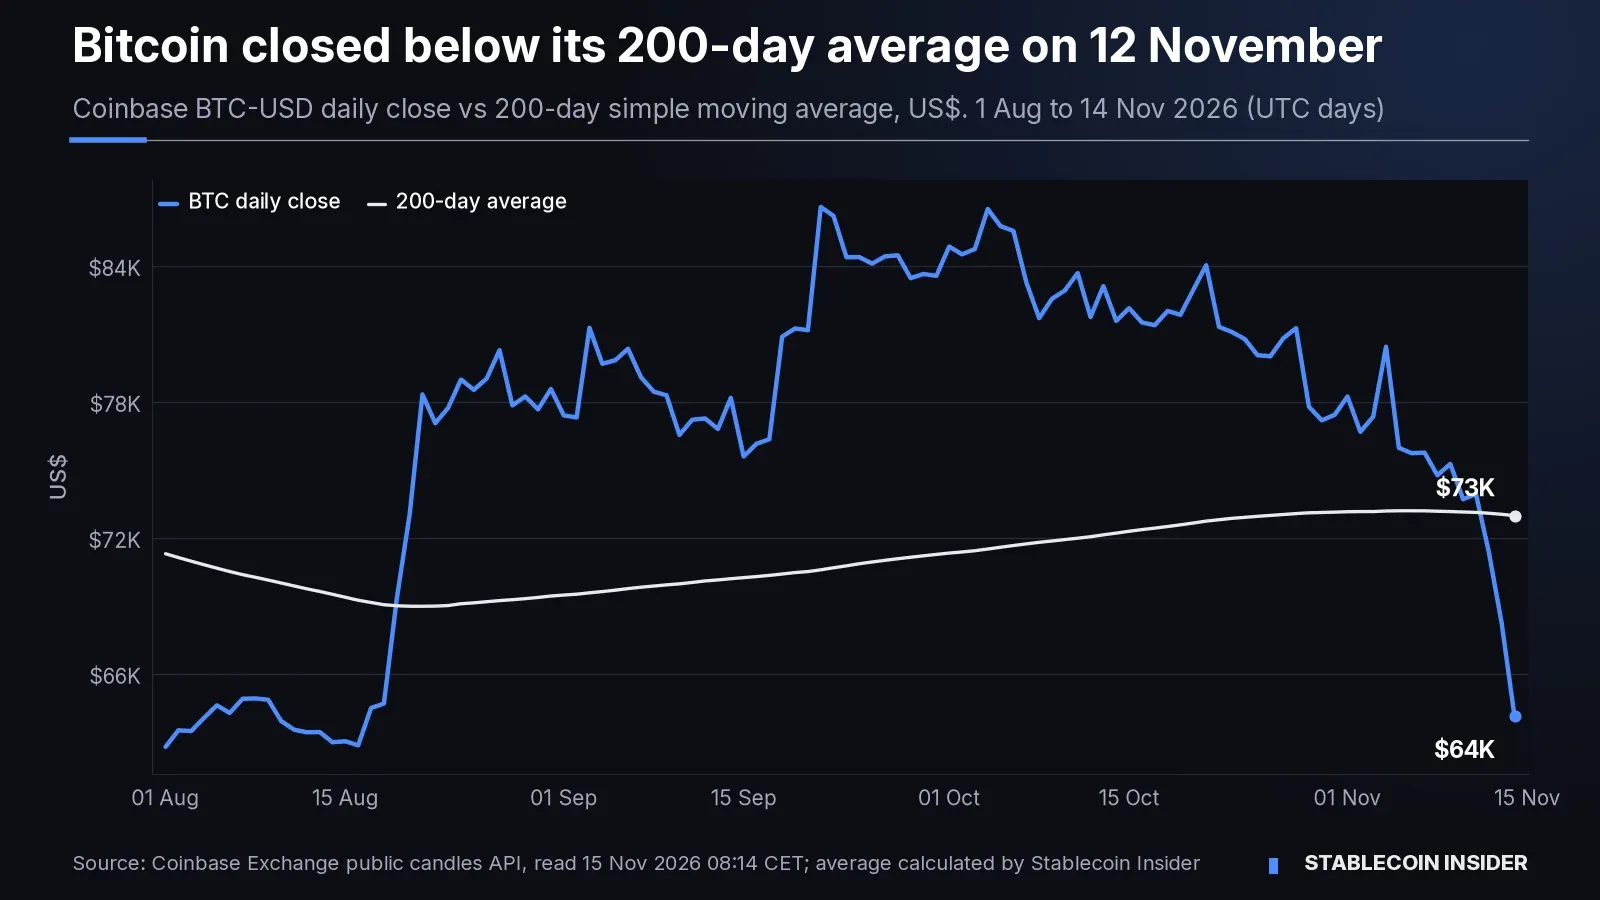
The chart shows the average has been flat at about $73,000 since late October, so it did not move down to meet the price. The break came from a steep drop in closes over three sessions, not a slow drift.
How much was liquidated in the selloff?
About $2 billion of crypto positions were liquidated in the 24 hours to 07:00 Singapore time on 15 November, with long positions accounting for the vast majority, according to Coinglass data cited by Bloomberg. Bitcoin positions made up $774 million and Ether $488 million. A day earlier, on 13 November, Bitcoin's slide had triggered roughly $1.3 billion of long liquidations over 24 hours.
A liquidation happens when an exchange closes a leveraged position because the trader's margin no longer covers losses. Bloomberg noted that 24-hour liquidations of more than $500 million in Bitcoin positions are becoming a recurring feature of this market. Coinglass's live dashboard did not load in our read-only check, so these totals rest on Bloomberg's reading of the data and may differ from figures shown later in the day.
What are traders blaming for the drop?
Traders are blaming several factors at once for the drop, and none of the coverage measures how much each one contributed. Bloomberg listed:
- Rates. Expectations of higher US interest rates (Bloomberg). The Federal Reserve's next meeting is on 8–9 December (Federal Reserve calendar).
- ETF outflows. US spot Bitcoin ETFs had almost $3 billion of net outflows from 30 October to 13 November. Our sum of Farside's daily data gives $2.99 billion. We covered the seven-day outflow streak on 14 November.
- Risk-off mood. Bloomberg cited an AI-fuelled risk-off mood. Richard Galvin, executive chairman of DACM, said Anthropic's upcoming IPO may be drawing capital away from crypto, adding that "it appears crypto remains a short-term funding source, particularly for retail investors."
- The Binance hack. Bloomberg also pointed to continued fallout from the Binance hack, which it put at $6 billion. US prosecutors have since obtained court orders over more than $1.2 billion of the stolen crypto, as we reported in our Binance hack seizure story.
Are stablecoins still shrinking?
Stablecoins are still shrinking over the month, though the past day was flat. Total supply in DefiLlama's daily series was $288.83 billion on 15 November, down $15.93 billion from $304.76 billion on 16 October and $25.55 billion below the 17 May peak of $314.38 billion. The one-day change was +$0.03 billion.
Investing.com, citing Glassnode, described a $17 billion contraction over the past month as a sign of reduced liquidity (Investing.com). The two providers measure supply slightly differently, so their totals do not match exactly. Our report on the stablecoin supply drop explains where the earlier redemptions came from.
Stablecoin Insider's take
Wondering how stablecoin supply feeds into crypto market liquidity? See our guide to stablecoin liquidity.
For the full picture of the rules shaping stablecoins and crypto markets, see our Stablecoin regulation hub.
FAQ
Why do different sites show different Bitcoin lows?
Is this Bitcoin's lowest price of 2026?
How did you calculate the 200-day average?
Did the selloff affect stablecoin pegs?
What happens next?
Next, watch three markers. The first is whether Bitcoin holds above the $59,500–$62,600 band Glassnode flagged and the $57,718 July low (Investing.com). The second is Monday's ETF data, which will show whether the outflow streak reaches eight sessions (Farside). The third is the Federal Reserve's 8–9 December meeting, given that traders cite rate expectations (Federal Reserve). GSR's Rosenblum told Bloomberg that Bitcoin may be near a technical floor; that is a view, not a forecast we can verify (Bloomberg).
Sources: Coinbase Exchange public candles API (BTC-USD, ETH-USD); Coinbase Bitcoin price; Coinbase Tether price; Bloomberg via The Straits Times (15 Nov 2026); Investing.com (15 Nov 2026); Farside Investors, Bitcoin ETF Flow (all data); DefiLlama, stablecoins dashboard; CoinGecko, global market data; Federal Reserve, FOMC calendar. All read on 15 November 2026. Coinglass figures are as reported by Bloomberg. Percentage changes, the 200-day average and the ETF sum are Stablecoin Insider calculations.
This content is provided for informational and educational purposes only and doesn't constitute financial, investment, legal or tax advice. Prices, liquidation totals, ETF flows and stablecoin supply figures were read on 15 November 2026 and can change quickly. It isn't a recommendation to buy, sell or hold Bitcoin, Ether, USDT, USDC or any ETF, or to use Coinbase, GSR, DACM or any other company mentioned.