

Table of Contents
Stablecoin supply is shrinking at its fastest pace in more than four years. On 11 November 2026, Glassnode reported that total stablecoin supply fell by $14.2 billion in the 30 days to 9 November, the steepest 30-day contraction since June 2022 (Glassnode, The Week Onchain).
The slide has continued since then. Stablecoin Insider read DefiLlama data on 12 November and found USD-pegged supply at $289.37 billion, about $14.9 billion below its level 30 days earlier. Tether's USDT and Circle's USDC account for $11.5 billion of that net decline.
Key Takeaways
- Glassnode puts the 30-day drop to 9 November at $14.2 billion and says holders are "taking that cash out of the market" (Glassnode).
- On DefiLlama, the rolling 30-day change reached about −$14.9 billion on 12 November. The last time it was that negative was 9 June 2022.
- USDT fell $8.31 billion (−4.5%) and USDC fell $3.20 billion (−4.4%). Sky's USDS and World Liberty Financial's USD1 each lost more than 20% of their supply.
- At $289.37 billion, USD-pegged supply is at its lowest since 23 September 2025 and 7.6% below its 17 May 2026 peak of $312.85 billion.
- USDT is trading a fraction of a cent below $1: $0.99916 on CoinGecko when we checked.
How much has stablecoin supply fallen in the last 30 days?
Stablecoin supply has fallen by $14.2 billion in the 30 days to 9 November, according to Glassnode. On DefiLlama's USD-pegged count, the fall is about $14.9 billion in the 30 days to 12 November. Glassnode says its stablecoin supply data runs through 9 November.
The sources count different sets of tokens, so their totals differ. The Block puts total supply "just below $280 billion", the lowest since September 2025. DefiLlama's broader USD-pegged list gives $289.37 billion, and its own low-water mark also dates to 23 September 2025. For the same window to 9 November, DefiLlama shows a smaller drop of $12.6 billion ($303.80 billion on 10 October to $291.21 billion on 9 November). Glassnode does not publish its token list in the report. Every source shows the same thing, though: the decline sped up through November.
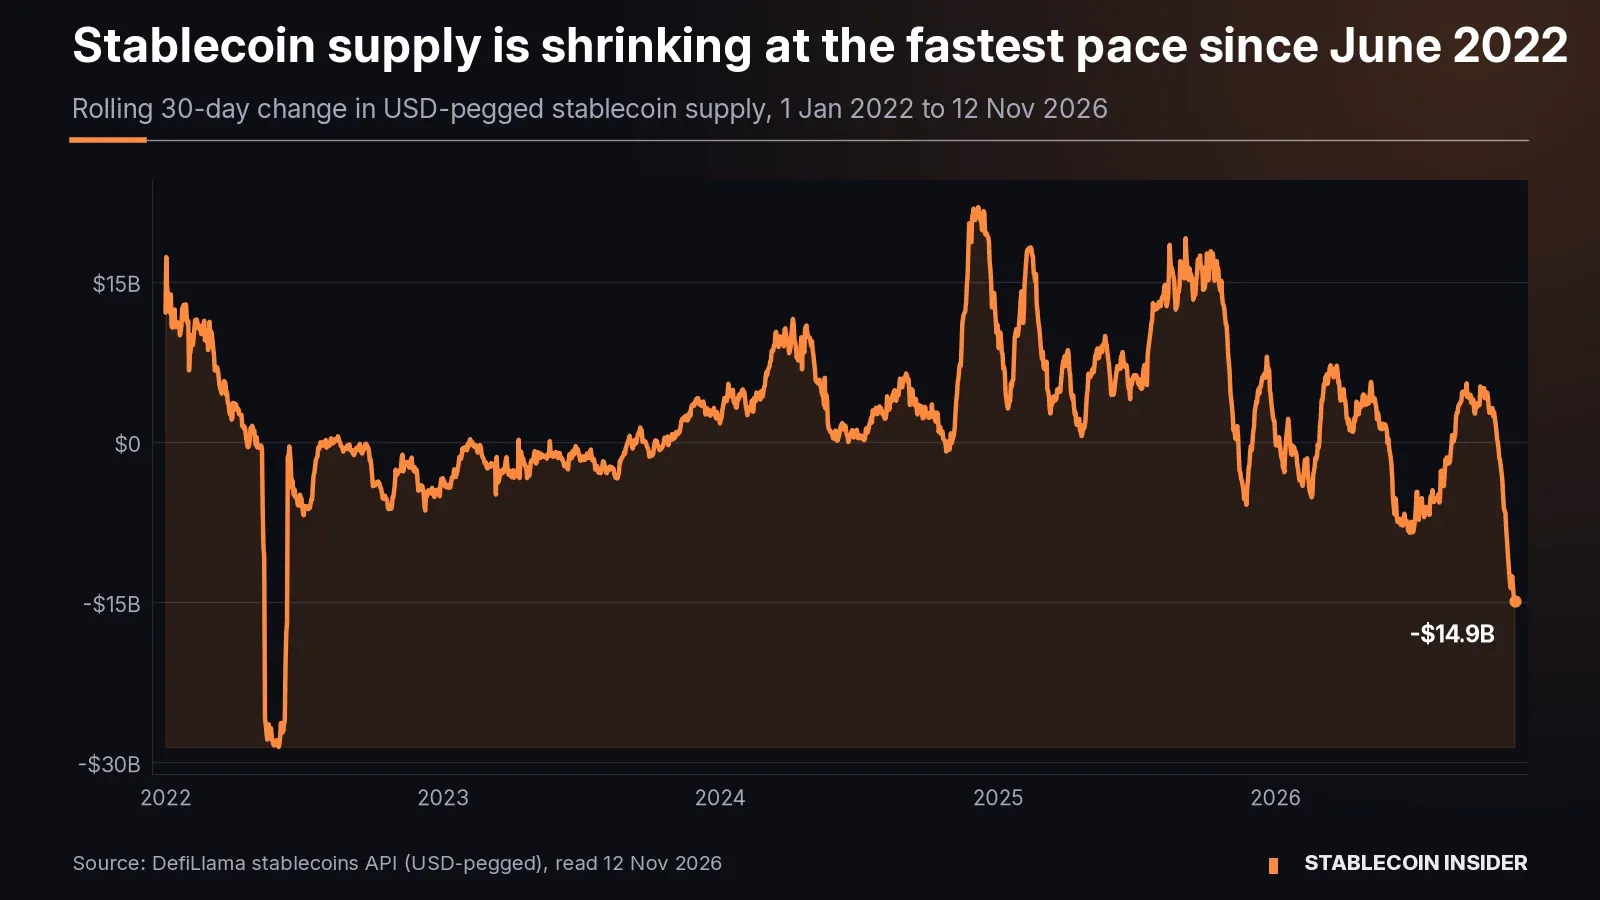
The chart shows how unusual this is. From mid-2022 the 30-day change stayed within about ±$7 billion until 2024. It then swung above +$15 billion during the late-2024 and 2025 growth spurts. Before this month, the deepest dip since 2022 was about −$8.5 billion, in late June 2026.
Which stablecoins are driving the drop?
USDT and USDC are driving most of the drop, but the steepest percentage falls are in smaller dollar tokens. The table below compares 30-day changes on DefiLlama for the six biggest decliners and the three biggest gainers. Each row links to its DefiLlama page.
| Stablecoin | Supply, 12 Nov | 30-day change | % change |
|---|---|---|---|
| USDT (Tether) | $175.64B | −$8.31B | −4.5% |
| USDC (Circle) | $69.66B | −$3.20B | −4.4% |
| USDS (Sky) | $5.37B | −$1.59B | −22.8% |
| USD1 (World Liberty) | $3.22B | −$1.04B | −24.3% |
| USDG (Global Dollar) | $2.70B | −$0.32B | −10.5% |
| USDD | $1.49B | −$0.29B | −16.5% |
| RLUSD (Ripple) | $2.71B | +$0.28B | +11.6% |
| OUSD (Open USD) | $0.96B | +$0.17B | +21.3% |
| USDe (Ethena) | $4.89B | +$0.13B | +2.7% |
Source: DefiLlama circulating supply vs. one month earlier, read 12 Nov 2026 at about 13:20 UTC. Figures rounded.
Two patterns stand out. First, USDT and USDC fell by almost the same percentage, and together they made up 77% of the net decline, slightly less than their 85% share of supply. The big two are shrinking with the market rather than losing ground to rivals. Second, the sharpest falls are in USDS, USD1 and USDD, which each lost between a sixth and a quarter of their supply. Gainers are rare: across DefiLlama's USD list, increases add up to $1.19 billion against $16.14 billion of declines.
DefiLlama records supply, not motive. Its figures cannot separate redemptions for cash from other ways supply can shrink, such as tokens an issuer burns or holds back. None of the issuers in the table had explained the moves in the sources we read.
Why does a shrinking stablecoin supply matter for crypto markets?
A shrinking stablecoin supply matters because stablecoins are the cash traders hold before buying, so fewer of them leaves less buying power. Glassnode's wording: "A shrinking supply means holders are redeeming stablecoins for dollars and taking that cash out of the market, which leaves less fuel for a rally" (Glassnode). Supply only falls when tokens are burned, which normally happens when an institution redeems them with the issuer (see our Circle Mint redemption guide).
The same Glassnode report pairs the stablecoin outflow with other signs of capital leaving. US spot bitcoin ETFs saw $1.6 billion of net outflows over 20 sessions, the Coinbase Premium has been negative on a 30-day average since the September high, and bitcoin was near $74,000, below the $75,600 short-term holder cost basis. Separately, CryptoQuant data cited by The Block showed USDT's market cap down $6.6 billion over the 60 days to 7 November. That is more than double the $3.2 billion fall over a similar stretch after FTX collapsed in December 2022.
Is USDT losing its dollar peg?
USDT is not losing its dollar peg in any material sense, but it is trading slightly below $1. CoinGecko showed $0.99916 when we checked on 12 November. DefiLlama's daily USDT prices over the previous two weeks ranged from $0.99875 to $0.99945, a discount of roughly 0.05% to 0.13%. Glassnode links the discount to the "same pressure" as the supply fall, and Cointelegraph also reported USDT slightly below its peg on TradingView data.
A gap that small sits within normal trading noise for a $175 billion token. It still matters for analysis: Glassnode says it strips out the Tether discount when it calculates the Coinbase Premium. To read deviations like this yourself, see how to monitor a stablecoin peg and our explainer on what counts as a depeg.
How does this drop compare with June 2022?
This drop is about half the size of the 2022 one. The Block says the 30-day decline "nearly reached $30 billion in June 2022". On DefiLlama, the worst 30-day reading that year was −$28.58 billion on 30 May 2022, the month TerraUSD (UST) collapsed. UST was an algorithmic stablecoin with $18.47 billion in circulation on 30 April 2022, per DefiLlama's UST record.
The make-up is also different. In 2022 the drop came as a large algorithmic stablecoin failed. In November 2026 the decline is spread across fiat- and asset-backed dollars that are still trading at or near $1. That makes this a story about demand and redemptions, not one about solvency.
Stablecoin Insider's take
Payment and treasury teams should read this as a market signal, not a reason to change rails. Supply going down does not make a fully reserved token less redeemable. It does mean less stablecoin liquidity on exchanges, which can widen spreads for large conversions.
Watching USDT's discount? See how to track peg deviations step by step.
For the full picture of the reserve and redemption rules that govern how issuers create and burn tokens, see our Stablecoin regulation hub.
FAQ
Does a falling stablecoin supply mean stablecoins are less safe?
What would signal that money is returning to stablecoins?
Where can I track stablecoin supply each week?
What happens next?
Next, the 30-day change has to stop falling. Three readings matter most over the coming weeks: whether the daily DefiLlama total stops falling, whether USDT gets back to $1, and whether US spot ETF flows turn positive again. Glassnode's next weekly report and our next weekly supply snapshot will show whether the contraction has peaked or is still building.
Sources: Glassnode, The Week Onchain (11 Nov 2026); The Block, stablecoin supply report (11 Nov 2026); Cointelegraph (12 Nov 2026); DefiLlama stablecoins dashboard and stablecoins API, with per-coin pages linked in the table; CoinGecko USDT price. All read on 12 November 2026.
This content is provided for informational and educational purposes only and doesn't constitute financial, investment, legal or tax advice. Supply and price figures were read from DefiLlama, CoinGecko and the reports cited on 12 November 2026 and change daily; different data providers count different tokens. It isn't a recommendation to buy, sell or hold USDT, USDC, USDS, USD1, USDG, USDD, RLUSD, OUSD, USDe, bitcoin or any other digital asset.