

Table of Contents
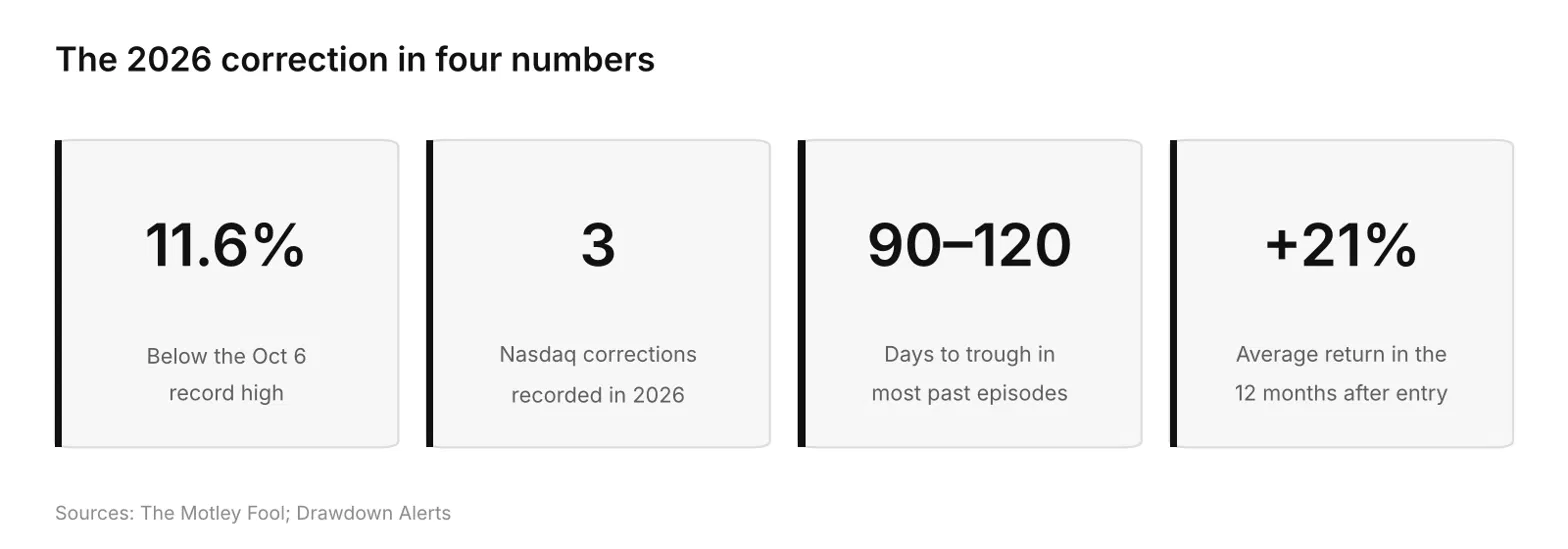
The Nasdaq Composite closed 11.6% below its October 6 record high on November 5, 2026, capping a single session in which the index fell 5.3% (Source: The Motley Fool).
Stablecoin Insider covers the market structure behind digital dollars, which means tracking the equity cycle that pushes capital into and out of them.
A Nasdaq correction is a decline of at least 10% from a record high, and the index has now recorded three of them in 2026 alone.
Each had a different depth, a different duration, and a different spillover into digital asset markets.
This article breaks down how deep the current correction has gone, how long past corrections have lasted, what happened the last three times, and which signals mark the turn.
Key Takeaways
- Nasdaq closed 11.6% below its October 6, 2026 record high on November 5.
- This is the Nasdaq's third correction of 2026, after March and July declines.
- Most Nasdaq corrections since 1985 bottomed within roughly 90 to 120 days.
- Average 12-month return after entering correction was 21% across nine recent episodes.
- Bitcoin fell 6.2% alongside the selloff as equity and crypto correlation returned.
Where the Nasdaq Stands Right Now
The correction was confirmed on the close of November 5, 2026. The index peaked just below 27,600 on October 6, then slid to 24,315 a month later, a drop of 11.6% (Source: The Motley Fool).
Metric | Reading |
|---|---|
Record high | Just below 27,600 on October 6, 2026 |
Close on November 5, 2026 | 24,315 |
Drawdown from high | 11.6% |
November 5 single-session move | Nasdaq down 5.3%, S&P 500 down 4.1% |
October 2026 monthly move | Nasdaq down 5.3%, worst month since March 2025 |
Corrections in the last decade | 10, roughly one per year |
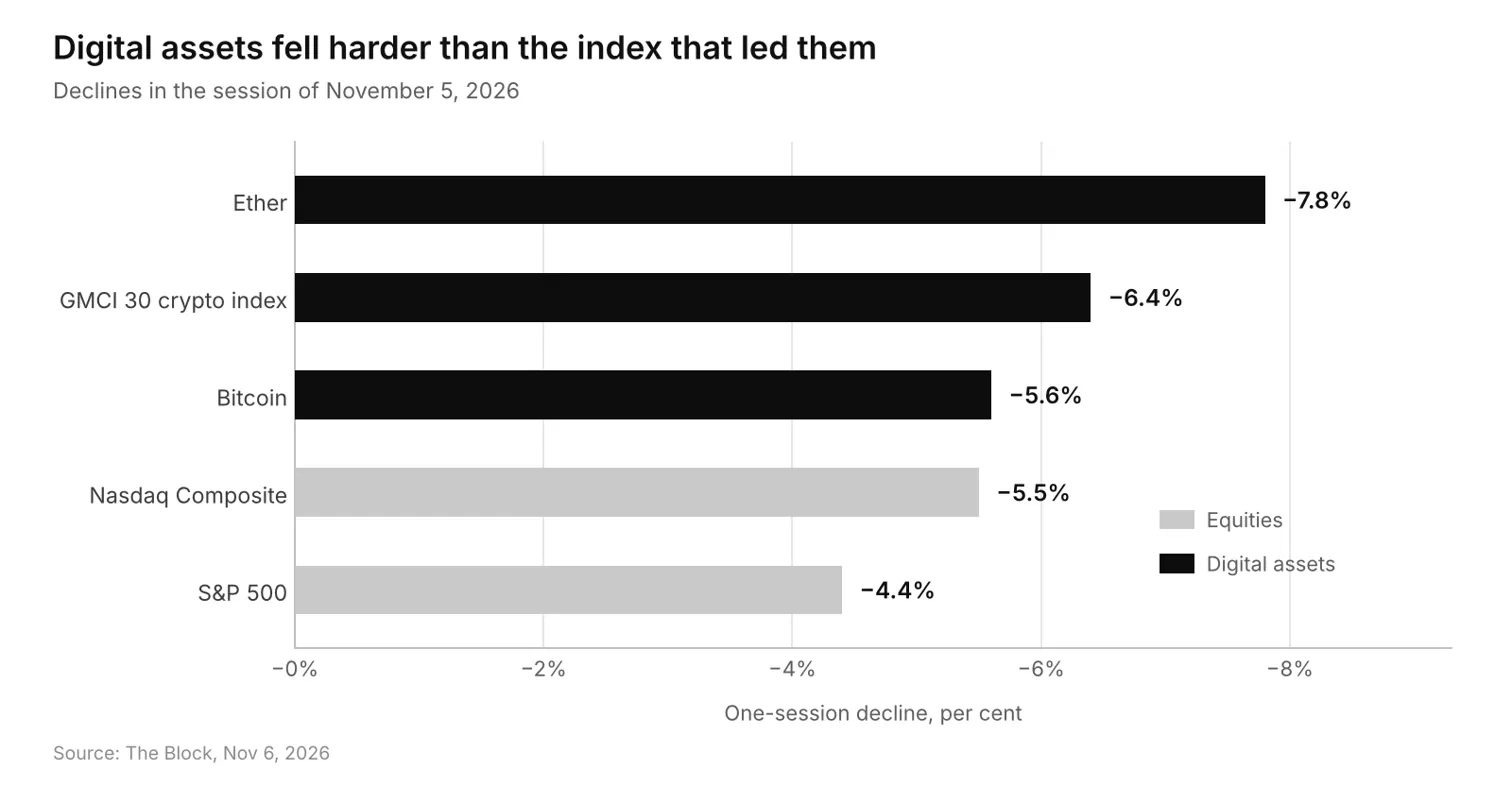
The single-day drop was broad rather than isolated. One crypto market desk logged the Nasdaq Composite down 5.5% and the S&P 500 down 4.4% in the same session, with the GMCI 30 index of large cryptocurrencies down 6.4% (Source: The Block).
That pairing matters for anyone watching digital asset prices as a read on risk appetite, a question we examined in our Bitcoin bottom alert analysis.
What Set Off the 2026 Correction
The proximate cause was a repricing of artificial intelligence infrastructure spending, not a macro shock.
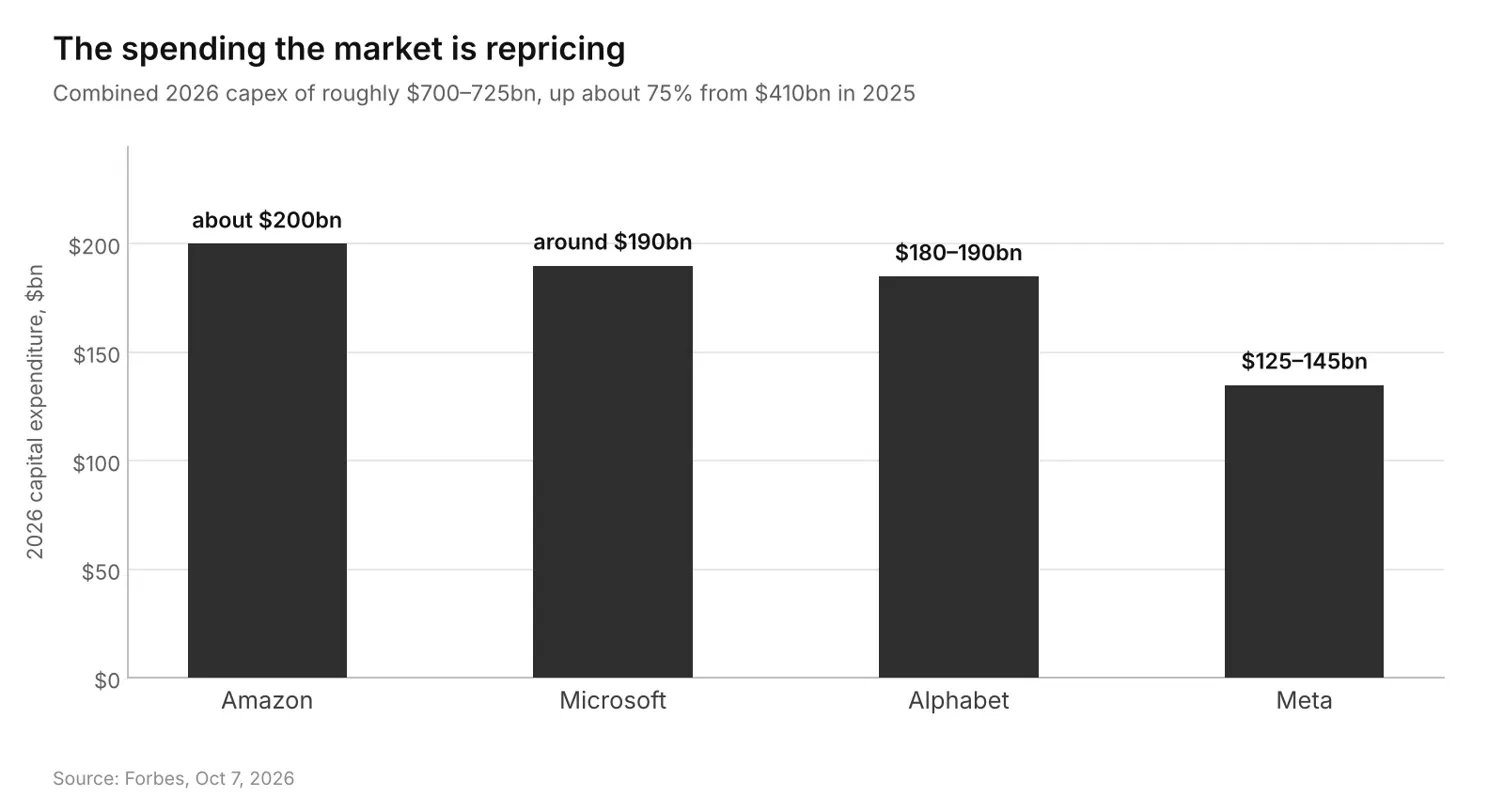
Combined 2026 capital expenditure for Amazon, Microsoft, Alphabet, and Meta is running at roughly $700 billion to $725 billion, up about 75% from a record $410 billion the prior year, with Wall Street projecting more than $1 trillion in 2027 (Source: Forbes).
The company-level numbers show how concentrated that bet is.
Amazon is spending about $200 billion, Microsoft around $190 billion, Alphabet $180 billion to $190 billion, and Meta $125 billion to $145 billion.
CreditSights estimates roughly three-quarters of hyperscaler capex funds AI infrastructure directly, and the same analysis notes that capex is projected to consume nearly all of the group's operating cash flow this year.
Two structural factors amplified the move.
- Semiconductor-related companies made up 46.4% of the Vanguard Information Technology ETF as of June 30, 2026, so a chip-led selloff transmits quickly through the whole index (Source: Yahoo Finance).
- The November 3 midterm elections removed a known unknown without resolving the policy questions around rates and tariffs, leaving positioning crowded on one side of the AI trade.
The same capex cycle underpins much of the infrastructure story we track in stablecoin trends for 2026.
How Deep: What the Depth Record Shows
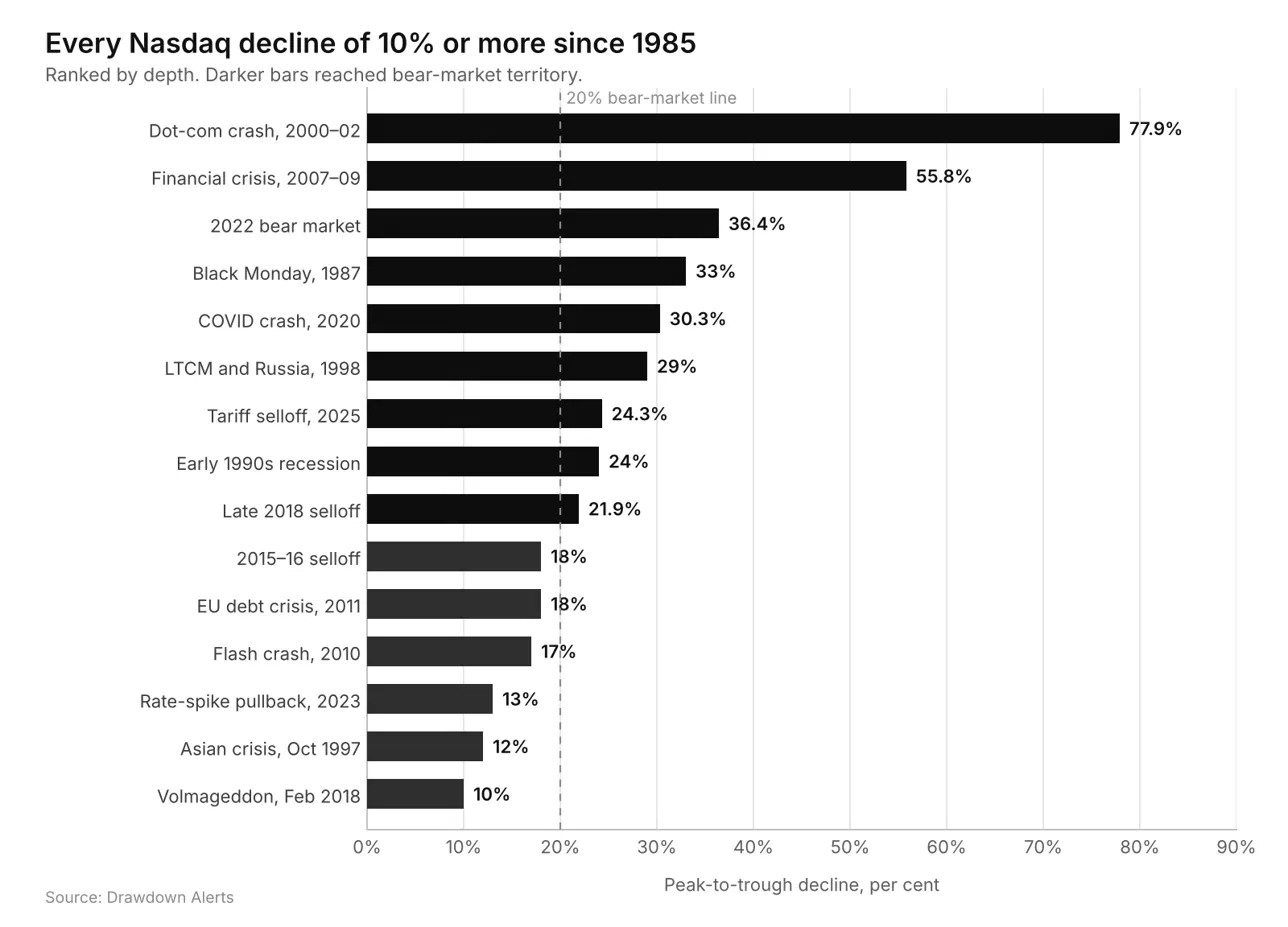
Ten percent is the entry threshold, not the typical outcome. Across 15 Nasdaq declines of 10% or more since 1985, nine went on to exceed 20%, which means roughly 60% of corrections that reached the 10% line kept going into bear market territory (Source: Drawdown Alerts).
The distribution splits into three recognizable bands:
- Shallow corrections of 10% to 15%; These cluster around single catalysts such as a rate scare or a volatility shock. The February 2018 episode stopped at roughly 10% and the October 2023 rate-spike pullback at roughly 13%.
- Deep corrections of 18% to 30%; These involve earnings revisions or a growth scare, not just multiple compression. The 2018 fourth-quarter selloff hit 21.9%, the COVID crash 30.3%, and the 2025 tariff selloff roughly 24.3%.
- Structural bear markets above 35%; These require a broken business model or a credit event. The 2022 bear market reached 36.4%, the financial crisis 55.8%, and the dot-com crash 77.9%.
At 11.6%, the current drawdown sits in the shallow band. Whether it stays there depends on whether AI capital expenditure guidance holds through the next two earnings cycles.
How Long: Duration and Recovery Timelines
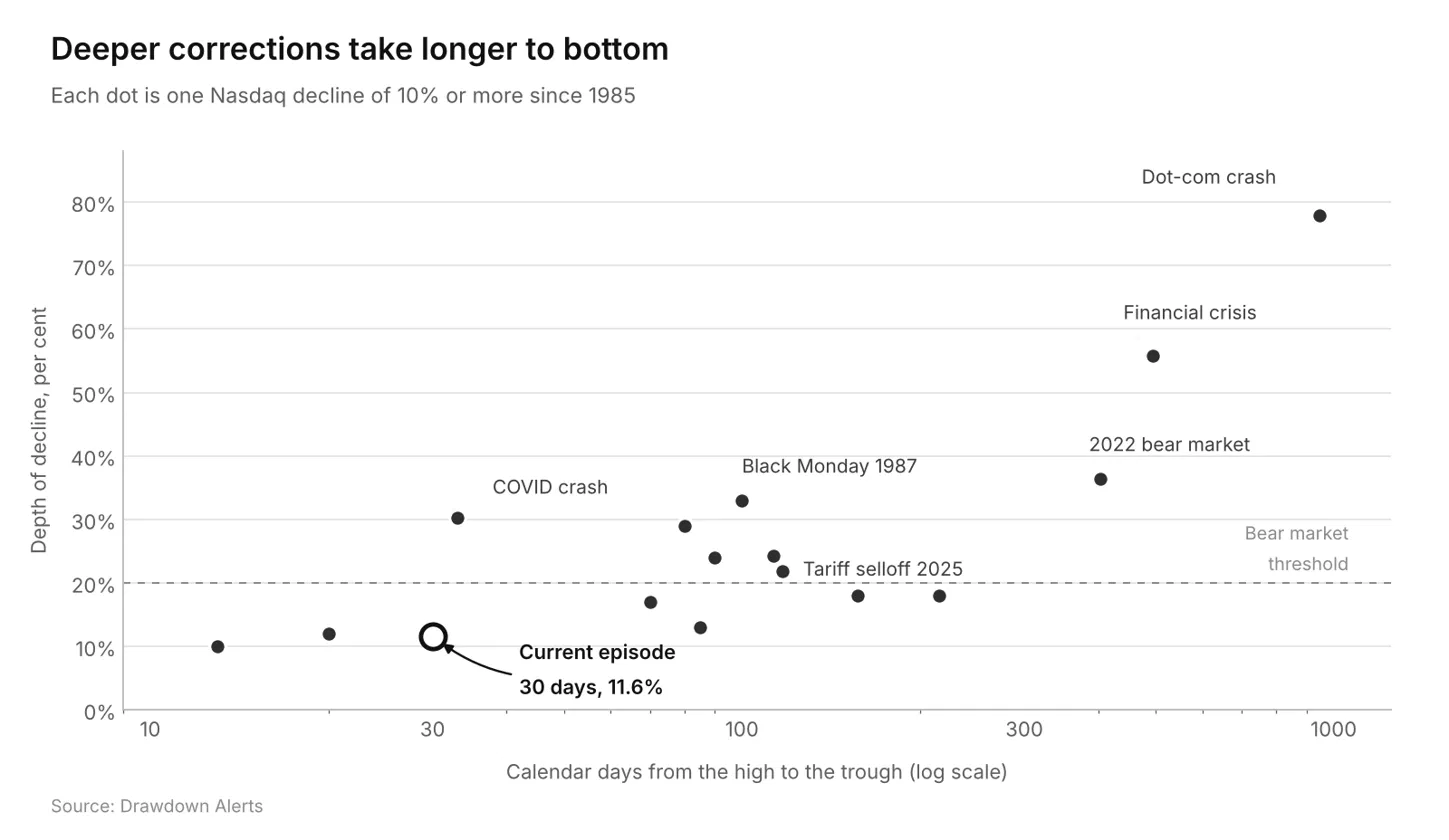
Duration and depth move together. The shortest declines resolved in weeks, while the deepest took years to repair.
Using the same 15-episode record, the fastest 10% decline bottomed in 13 days (February 2018) and the COVID crash bottomed in 33 days.
The middle of the distribution is more instructive: the 1990 recession selloff ran about 90 days, the October 2023 pullback about 85 days, the 2025 tariff selloff about 113 days, and the 2018 fourth-quarter decline about 117 days.
Only four episodes exceeded 200 days, and three of those were full bear markets (Source: Drawdown Alerts).
Recovery from the trough follows the same pattern. The COVID crash and the 2025 tariff selloff each needed only about 2.5 months to recover.
The 2022 bear market took roughly 1.9 years. The dot-com crash took about 12.5 years, which remains the outlier that anchors every bubble comparison.
The practical read:
- A correction that stops under 15% has historically repaired itself in a quarter or two.
- A correction that breaks 25% has historically taken years.
- The current episode is 30 days old as of November 5, 2026, which places it earlier than the median episode is at its floor.
What Happened Last Time: The 2026 Correction Record
The Nasdaq has corrected three times in 2026 and four times in the last 22 months.
The first two 2026 episodes both resolved into new record highs within roughly two months of their lows (Source: Yahoo Finance).
Episode | Prior high | Correction low | Depth | Outcome |
|---|---|---|---|---|
April 2025 tariff selloff | 20,118.61 on Jan 24, 2025 | 14,784.03 intraday on Apr 7, 2025 | 26.5% intraday, 24.1% on a closing basis | New record high by Oct 2025 |
Correction 1 of 2026 | 24,019.99 on Oct 29, 2025 | 20,794.64 close on Mar 30, 2026 | 13.4% | New record high by Jun 1, 2026 |
Correction 2 of 2026 | 27,190.21 on Jun 1, 2026 | 24,442.94 close on Jul 29, 2026 | 10.1% | New record high by Oct 6, 2026 |
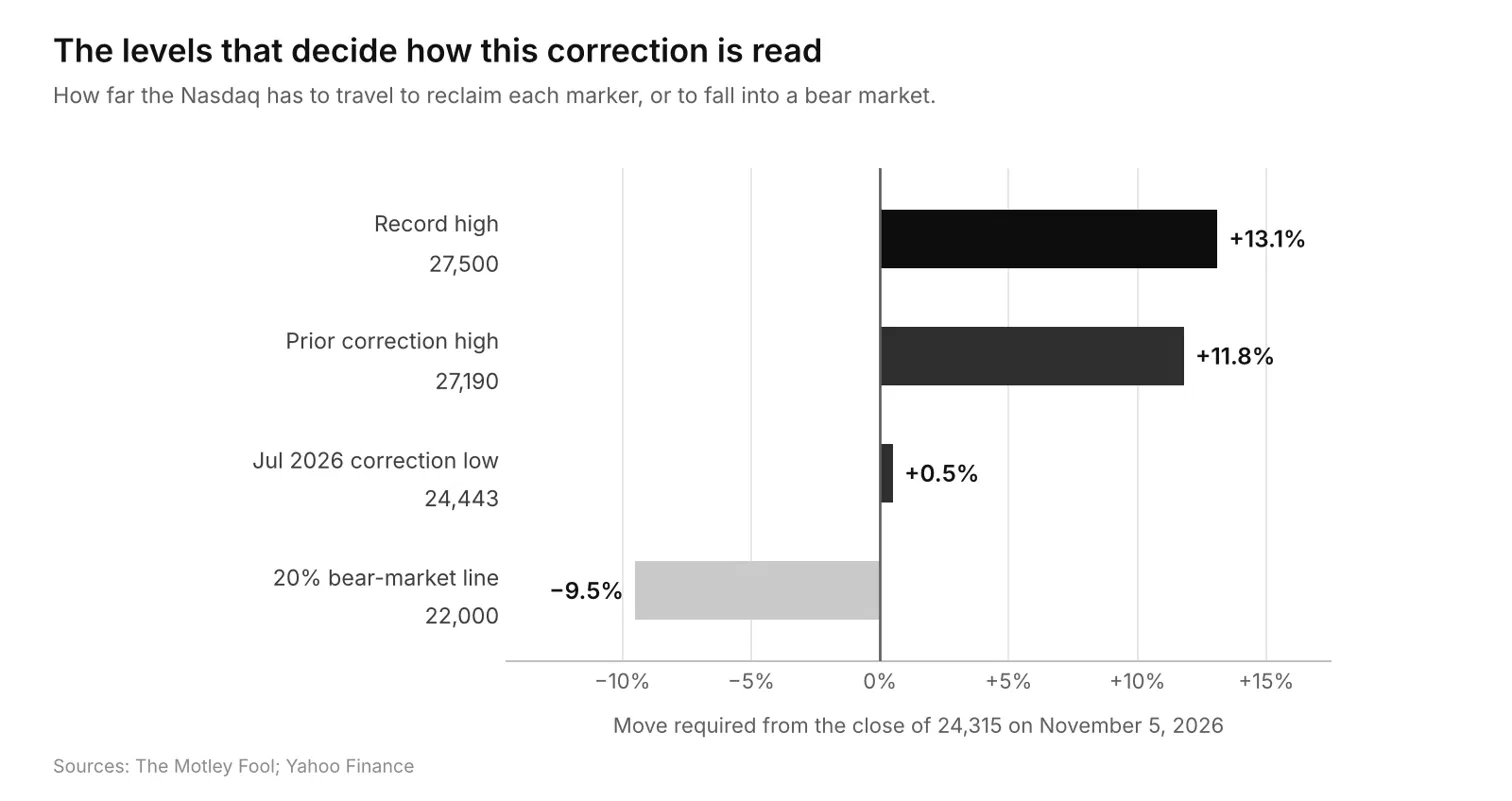
Correction 3 of 2026 | Just below 27,600 on Oct 6, 2026 | 24,315 close on Nov 5, 2026 | 11.6% | Unresolved |
One pattern stands out. Each correction low in this sequence has been higher than the high that preceded the prior correction, which is the classic signature of an advancing market rather than a topping one.
- The March 2026 low of 20,794 sat above the January 2025 high of 20,119.
- The July 2026 low of 24,443 sat above the October 2025 high of 24,020.
- The current low of 24,315 is the first in the sequence to fall slightly below the prior correction's high, which is why the November episode is being watched more closely than the two before it.
The Longer Record: Nasdaq Drawdowns Since 1987
Every major Nasdaq decline of 10% or more since 1985 is listed below with its depth, duration to the trough, and recovery time from the trough (Source: Drawdown Alerts).
Correction, Bear Market, or Crash
The labels are arbitrary thresholds, but they shape how institutions behave because mandates and risk limits are often written around them.
- A pullback is a decline of 5% to 9.9% from a record high. These happen several times a year and rarely change allocation.
- A correction is a decline of 10% to 19.9%. This is the band the Nasdaq entered on November 5, 2026.
- A bear market is a decline of 20% or more. Nine of the 15 Nasdaq declines since 1985 reached this level.
- A crash is informal and describes speed rather than depth, typically a 20% drop within a few weeks.
The distinction matters operationally.
- Crossing 10% triggers rebalancing rules at many funds.
- Crossing 20% triggers de-risking mandates, forced deleveraging, and in 2026, redemptions from the vehicles holding the most crowded exposures.
That is the mechanism that turns an equity decline into a liquidity event across asset classes, including the short-duration instruments described in our analysis of stablecoins and the US Treasury market.
Why Concentration Changes the Math
The Nasdaq Composite tracks more than 3,000 companies, but the exposure that drives it is far narrower.
The top ten holdings of the Nasdaq-100 carry these weights: Apple 8.3%, Nvidia 7.8%, Microsoft 6.7%, Alphabet 5.3%, Amazon 4.7%, Micron 4%, AMD 3.6%, Tesla 3.3%, Meta 2.8%, and Walmart 2.8% (Source: The Motley Fool).
That is roughly 49% of the index in ten names, four of which are the same hyperscalers funding the capex cycle and three of which are semiconductor manufacturers selling into it. A guidance change at one supplier can move half the index.
Concentration has been the source of the returns as well as the risk.
The Invesco QQQ Trust has returned 1,480% since 1999, or 10.5% annualized, against 885% and 8.6% annualized for the S&P 500 over the same window.
Investors have been paid for that concentration, which is precisely why unwinding it produces drops of 5% in a single session.
How the Correction Reaches Crypto and Stablecoins
The transmission from Nasdaq to digital assets was immediate and measurable.
Bitcoin had rallied to $81,105 on November 4, then fell to an intraday low of $75,468 on November 5, a decline of about 6.2% from the peak (Source: Bitcoin.com News).
The leverage unwind came with it. Coinglass data showed $838.54 million in liquidations over 24 hours, of which $741.04 million were long positions, with roughly $554.66 million concentrated in a single hour as the Nasdaq accelerated lower.
Fund flows confirmed the risk-off read.
US spot crypto exchange-traded funds saw more than $540 million in net outflows in one session and more than $1.1 billion week to date, led by Fidelity's FBTC at $199.9 million and BlackRock's IBIT at $105 million.
Ether fell 7.8% against bitcoin's 5.6% on the day (Source: The Block).
Stablecoin supply tells a quieter story. Total stablecoin market capitalization stood at $293.9 billion on November 5, 2026, down about 1.7% or $4.9 billion over the preceding 90 days (Source: Stablecoin Beat).
A contracting float during an equity drawdown suggests capital leaving the system entirely rather than rotating into digital dollars, which is a different signal from the 2022 cycle.
Our stablecoin statistics for 2026 page tracks that float week by week, and how to monitor a stablecoin peg covers the mechanics of watching for stress.
What Treasury and Finance Teams Do During a Drawdown
A correction is a liquidity and duration test, not a directional call. The teams that handle it well tend to work through the same sequence.
- Re-verify liquidity before yield; Confirm which balances can be converted to fiat within one business day and at what haircut. Our guide to stablecoin treasury management covers the operational tiering.
- Separate operating cash from yield positions; Payroll and vendor obligations should not sit in any instrument whose redemption depends on market conditions.Business accounts that hold stablecoin balances list which providers support same-day settlement.
- Reprice the yield you are earning against the risk you are taking; Spreads widen in drawdowns, and so does counterparty risk. Yield-bearing stablecoins in 2026: breaks down which yields are structural and which are incentive-driven.
- Shorten duration where the mandate allows it; Tokenized treasury funds have become the standard parking instrument for teams that want short-duration government exposure with on-chain settlement.
- Stress-test the leverage you cannot see. Positions that are collateralized against volatile assets are the first to be liquidated, as the $741 million in long liquidations on November 5 demonstrated.
Signals Worth Tracking From Here
Five observable markers separate a 13% correction that repairs in a quarter from a 25% decline that takes years.
- Capex guidance: The 2027 consensus of more than $1 trillion in hyperscaler spending is the load-bearing assumption. A single downward revision validates the selloff thesis.
- Semiconductor earnings breadth: With chips at 46.4% of the technology sector weighting, a broadening of weakness beyond one or two names changes the depth math.
- The prior correction high at 27,190: Reclaiming the June 2026 peak would restore the higher-lows sequence that defined the 2025 and 2026 advances.
- Crypto ETF flows: Week-to-date outflows above $1.1 billion reflect positioning, not conviction. A flip to net inflows typically precedes equity stabilization rather than following it.
- Stablecoin float direction: A float that resumes expanding signals capital staging for redeployment. A float that keeps contracting signals capital exiting. DeFi risk management covers how to position for either outcome.
JPMorgan strategists estimate AI adoption is occurring roughly three times faster than internet adoption, which is the argument for why this cycle is not 2000. It is also the reason the drawdowns are sharper.
Conclusion
Stablecoin Insider exists to connect digital dollar market structure to the broader capital cycle that drives it, because treasury decisions are made in that context rather than in isolation.
The Nasdaq Composite is 11.6% below its October 6, 2026 record high, which places the current correction in the shallow band where most episodes since 1985 have resolved inside one or two quarters.
The three 2026 corrections ran 13.4%, 10.1%, and 11.6%, and the first two recovered to new highs within roughly two months of their lows.
The record offers no guarantee, but it does set the odds: eight of the last nine Nasdaq corrections produced positive returns over the following 12 months, averaging 21%.
Read Next
- GateHub EURGH: MiCA Euro Stablecoin Live on XRPL
- MoonPay Alternatives: 7 Fiat On-Ramps for USDC
- Coinbase Commerce Alternatives: 7 Stablecoin Gateways
FAQs
1. How deep is the Nasdaq correction in 2026?
The Nasdaq correction in 2026 is 11.6% deep as of the November 5 close, measured from the record high set just below 27,600 on October 6, 2026. The index closed at 24,315. That places it in the 10% to 15% band, where most Nasdaq corrections since 1985 have found their floor.
2. How long do Nasdaq corrections usually last?
Nasdaq corrections usually last between 13 and 120 days to the trough, with most clustering around 85 to 117 days. The fastest on record bottomed in 13 days in February 2018, and the COVID crash bottomed in 33 days. Only four episodes since 1985 exceeded 200 days, and three of those were full bear markets.
3. What happened the last time the Nasdaq entered a correction?
The last time the Nasdaq entered a correction was July 2026, when the index fell 10.1% from its June 1 peak of 27,190.21 to close at 24,442.94 on July 29. It recovered to a new record high by October 6, 2026. The correction before that, in March 2026, ran 13.4% and recovered to a new high within roughly two months.
4. What is the difference between a Nasdaq correction and a bear market?
The difference between a Nasdaq correction and a bear market is the depth threshold. A correction is a decline of 10% to 19.9% from a record high, while a bear market is a decline of 20% or more. Nine of the 15 Nasdaq declines of 10% or more since 1985 went on to become bear markets.
5. How does a Nasdaq correction affect stablecoins and crypto?
A Nasdaq correction affects stablecoins and crypto through correlated risk-off flows. During the November 5, 2026 session, bitcoin fell 5.6%, ether fell 7.8%, US spot crypto ETFs recorded more than $540 million in outflows, and $838.54 million in leveraged positions were liquidated. Total stablecoin supply stood at $293.9 billion, down 1.7% over 90 days.
Disclaimer: This content is provided for informational purposes only and does not constitute legal, financial, or compliance advice. Protocol versions, governance arrangements, and partner counts cited here reflect publicly announced milestones as of November 2026 and are moving quickly. Adoption figures come from vendor and foundation announcements with differing methodologies and should be treated as directional signals rather than guaranteed outcomes.