Table of Contents
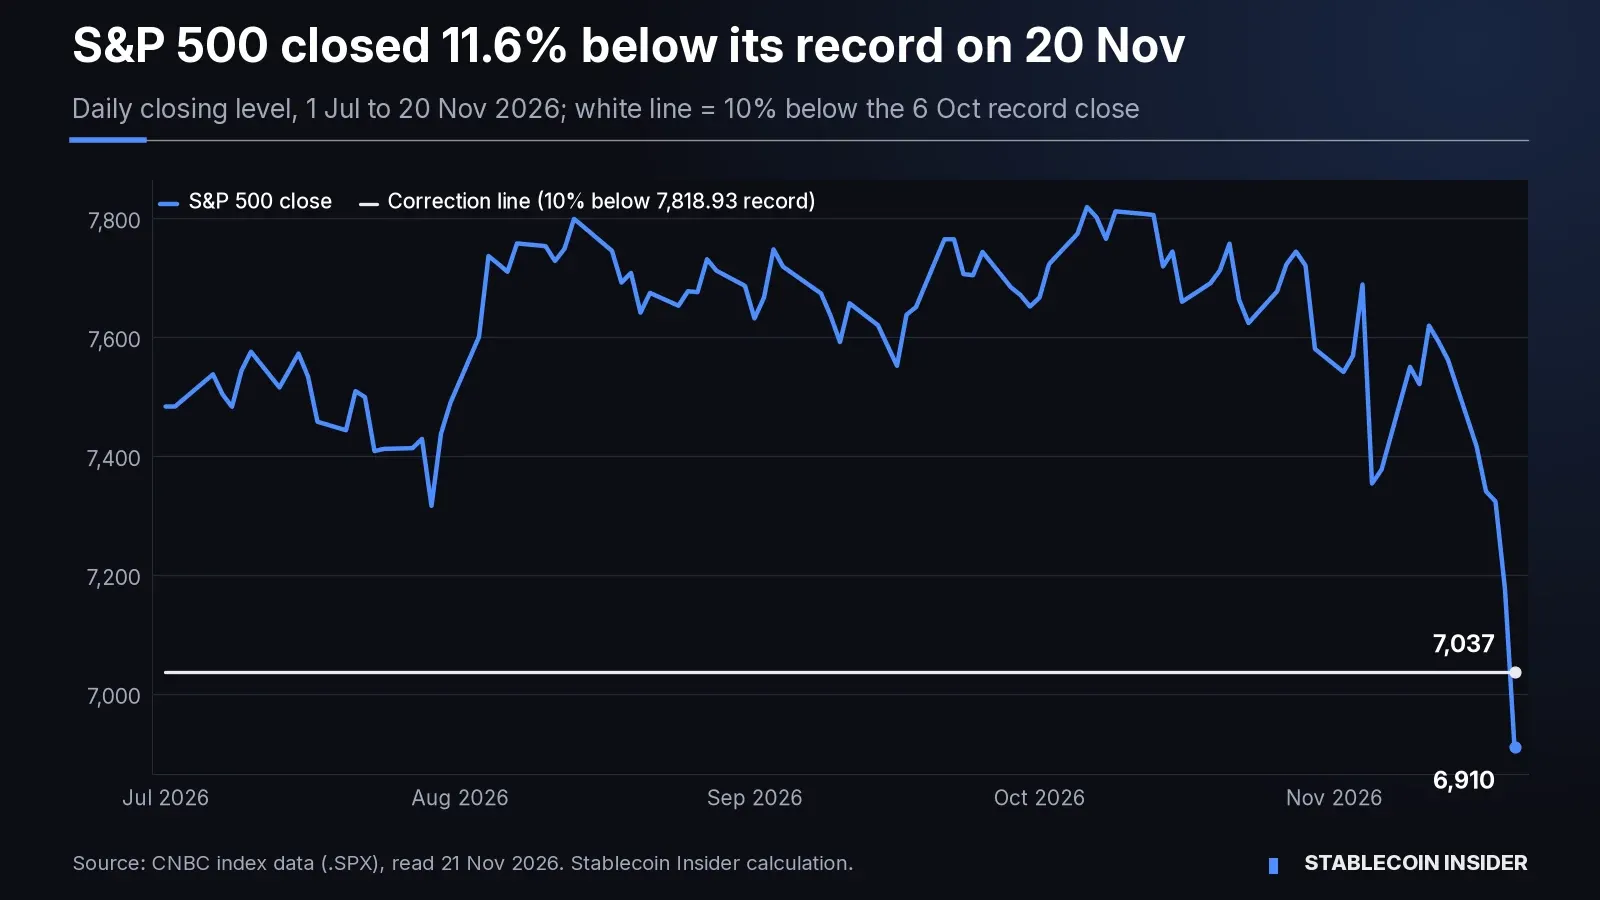
The stock market is falling because an AI-led sell-off pushed the S&P 500 into a correction on Friday, 20 November 2026. The index closed at 6,910.39, down 3.7% on the day and 11.6% below its 6 October record close of 7,818.93 (CNBC S&P 500 data). A correction means a drop of 10% or more from a record.
The Dow Jones Industrial Average joined it, closing 11.4% below its 5 August record. The Nasdaq Composite fell 5.28% and turned negative for 2026, while the Nasdaq-100 closed 19.8% off its peak, about 49 points above the 20% bear-market line (Nasdaq).
By Milos Djukanovic. Updated 21 November 2026, 07:45 CET, with Friday closing data and Saturday-morning crypto prices.
At a Glance
- The S&P 500 has now fallen seven sessions in a row, its longest losing streak since February 2020 (CNN). The run took 9.3% off the index.
- Nvidia fell 14% on Friday to $125.53 and is 47.5% below its 6 October close (Nasdaq). CNBC tied Friday's drop to a Reuters report of an SEC probe into its accounting (CNBC).
- Anthropic (ANT) closed at $88.91 in its second session, 8.5% lower on the day and just above its $83 IPO price (Nasdaq).
- The VIX "fear gauge" closed at 35.89, its highest close since 11 April 2025 (Cboe).
- The Fed's next decision is due on 9 December. Rates are at 3.75% to 4.00%, and two officials voted for a hike in October (Federal Reserve).
The Correction in Four Numbers
The table below compares each index's record close with Friday's close. Records and closes come from the linked index data. The percentages and threshold levels are our own calculations.
| Index | Record close | 20 Nov close | From record |
|---|---|---|---|
| S&P 500 | 7,818.93 (6 Oct) | 6,910.39 | −11.6% |
| Dow Jones | 54,349.12 (5 Aug) | 48,147.33 | −11.4% |
| Nasdaq Composite | 27,599.89 (6 Oct) | 22,617.73 | −18.1% |
| Nasdaq-100 | 31,224.69 (6 Oct) | 25,028.98 | −19.8% |
The levels that mark a correction and a bear market for each index, measured from the record closes above:
| Index | Correction line (−10%) | Bear-market line (−20%) |
|---|---|---|
| S&P 500 | 7,037.04 | 6,255.14 |
| Dow Jones | 48,914.21 | 43,479.30 |
| Nasdaq Composite | 24,839.90 | 22,079.91 |
| Nasdaq-100 | 28,102.22 | 24,979.75 |
The Nasdaq-100 is the index to watch on Monday. It touched 24,910.48 during Friday's session, 20.2% below its record, before it closed just above the bear-market line. CNBC also said the index entered bear-market territory during the day (CNBC). The Nasdaq Composite is about 540 points from that line.
Key Moments of the Seven-Day Slide
The streak began after the S&P 500 closed at 7,619.38 on 11 November. These are the daily closes from CNBC index data:
- 12–13 Nov: small losses of 0.35% and 0.40%, to 7,561.67.
- 16 Nov: down 1.92% to 7,416.59. CNBC reports that the Commerce Department tightened remote-access rules on US chips that week.
- 17 Nov: down 1.03% to 7,340.53. On Nvidia's earnings call that day, the board ruled out a return for Jensen Huang (our earnings-call report).
- 18 Nov: down 0.23% to 7,323.63. Anthropic priced its IPO at $83 that evening (our IPO report).
- 19 Nov: down 2.02% to 7,175.83. ANT opened at $111.50 and closed at $97.17 (our day-one report). CNBC says the S&P 500 made a "convincing break" of its 200-day moving average.
- 20 Nov: down 3.70% to 6,910.39, the first close in correction territory.
Five Pressures Behind the Sell-Off
The sell-off has five main causes, according to CNBC's breakdown and CNN's market report:
- AI "sell the news". Anthropic's record IPO looked to many traders like a cash-out moment for the AI trade, not the start of a new leg up.
- Nvidia. The stock lost 22.9% this week, from $162.85 to $125.53 (Nasdaq). CNN called it Nvidia's worst week since October 2008.
- The Fed. The Fed raised rates by a quarter point in September, then held in October (Federal Reserve). Governor Christopher Waller told CNBC that a half-point hike may be needed in December: "I'm very, very concerned about inflation."
- Trend-following sellers. CNBC says the break below the 200-day average turned systematic funds into automatic sellers.
- Slowing AI growth and politics. CNBC notes Anthropic's revenue growth slowed to 47% in the third quarter from 144% in the second. Investors also expect possible new limits on data centres after the Democrats' election wins.
What an 11.6% Drop Means for an Index Fund
For an S&P 500 index fund, an 11.6% drop means $10,000 invested at the 6 October record close was worth about $8,838 at Friday's close. That figure counts price only, not dividends or fund fees.
To get back to the record, the index now needs to rise 13.1%. The S&P 500 is still up 0.95% for 2026, against its 31 December 2025 close of 6,845.50. The Nasdaq Composite is down 2.7% year to date (CNBC). Our Nasdaq correction tracker shows how long past corrections lasted. Most of its history was written before this week's drop.
Fear Gauge, Treasuries and Crypto React
Investors moved out of shares and into safer assets. The VIX rose from 19.30 on 13 November to 35.89 on Friday, an 86% jump (Cboe). The 10-year Treasury yield fell to 4.92% on 20 November, from 5.04% the day before (US Treasury).
Crypto followed stocks lower. Bitcoin traded at about $55,889 at 07:27 CET on Saturday, down 9.5% in 24 hours (CoinGecko). The total stablecoin supply fell from $287.77 billion on 13 November to $282.60 billion on 21 November, down 1.8% (DefiLlama).
A higher Fed rate tends to mean higher yields on Treasury bills. That matters for stablecoin issuers, because Treasury bills back most of their reserves.
Our Take
This correction is about prices that ran ahead of the AI story, with a Fed that is still raising rates. The S&P 500 is still positive for the year. The two numbers to watch are the Nasdaq-100's 24,979.75 bear-market line and the 9 December Fed decision. A close below that line, or a half-point hike, would mean the drop has moved past a routine reset.
Dates to Watch
- Mon 23 Nov: the first session after the correction close. Watch whether the Nasdaq-100 closes below 24,979.75.
- Thu 26 Nov: US markets are closed for Thanksgiving. They close early at 1:00 p.m. ET on Fri 27 Nov (NYSE).
- 8–9 Dec: FOMC meeting with new economic projections (Federal Reserve calendar).
- Any SEC statement on the reported Nvidia probe. We found no SEC confirmation when we checked.
Rate moves feed straight into what stablecoins and tokenised Treasuries pay. For the full picture, see our Stablecoin yield hub.
Sources: CNBC S&P 500 data; CNBC Dow data; Nasdaq Composite history; Nasdaq-100 history; Nvidia history (Nasdaq); Anthropic history (Nasdaq); Cboe VIX history; US Treasury yield curve; Fed 28 October statement; FOMC calendar; NYSE holidays; CNBC sell-off analysis; CNBC market live blog; CNN Business; CoinGecko; DefiLlama. All read on 21 November 2026 between 07:15 and 07:30 CET. Distances from records, threshold levels, the streak total, the $10,000 example and the week-on-week changes are Stablecoin Insider calculations from those figures.
This content is provided for informational and educational purposes only and doesn't constitute financial, investment, legal or tax advice. Index levels, prices and yields were read on 21 November 2026 and change constantly. This isn't a recommendation to buy or sell the S&P 500, Dow, Nasdaq, Nvidia, Anthropic, bitcoin or any stablecoin. Past corrections don't predict future returns.