Table of Contents
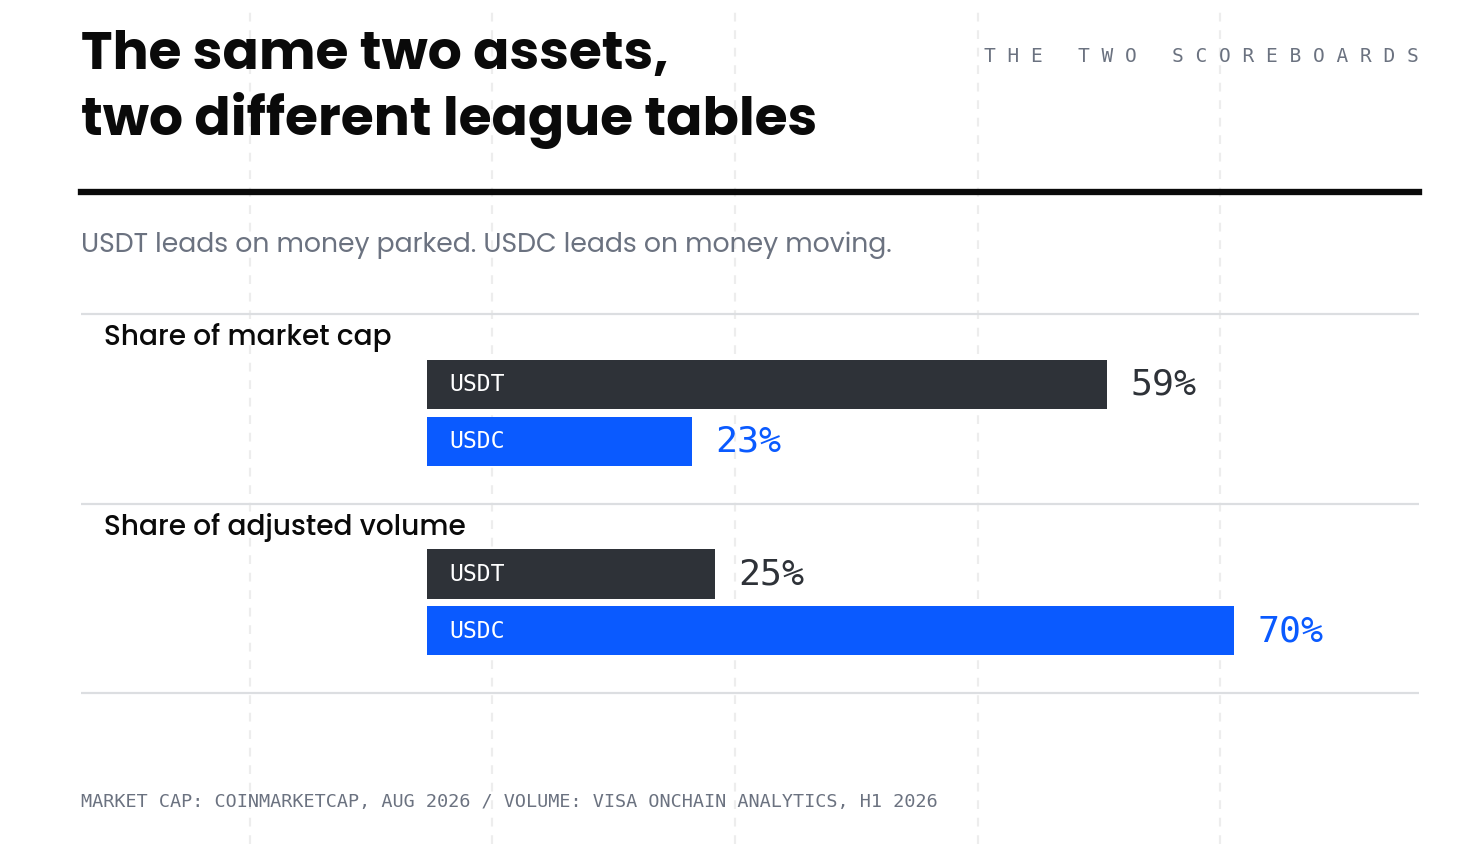
Every stablecoin ranking you have ever seen is sorted by market capitalization.
Tether at roughly $183 billion, Circle's USDC at roughly $72 billion, everyone else fighting for scraps below $10 billion. Two issuers, more than 80% of a ~$310 billion market. The story writes itself: Tether won, Circle is a distant second, and the gap is not closing.
Now sort by a different column.
Across the first half of 2026, USDC accounted for about 70% of adjusted stablecoin transaction volume. USDT accounted for roughly 25%.
In 2020 those numbers were almost exactly reversed, with USDT handling close to 90% and USDC under 10%. By 2022 USDC had climbed to around 45%. It has kept climbing since.
The same two assets. Two completely different league tables. Only one of them gets printed.
How the Volume Number is Calculated
The volume figures come from Visa's Onchain Analytics dashboard, built with the blockchain data firm Allium Labs. Raw on-chain volume is close to useless as a measure of economic activity.
It counts bot traffic, market-maker rebalancing, exchange treasury shuffling, and smart contracts passing the same dollars back and forth in loops. The adjusted methodology strips that out and tries to leave behind transfers that represent someone actually paying someone.
The filtering is aggressive. Visa's own estimate is that organic volume runs somewhere around a quarter to a third of the raw figure.
What survives the filter is still enormous, and still accelerating. June 2026 set a record at $1.79 trillion in adjusted volume, up 63% from May's $1.1 trillion and up 125% from roughly $795 billion in June 2025.
The first six months of the year totalled $8.82 trillion. That is more than the $5.8 trillion recorded across all of 2024, and within about $2 trillion of the full-year 2025 record of $10.8 trillion. Half a year, nearly a full year's worth of settlement.
USDC Moves Seven Times Faster than USDT
Put the two columns together and the divergence stops being a curiosity and becomes a structural fact.
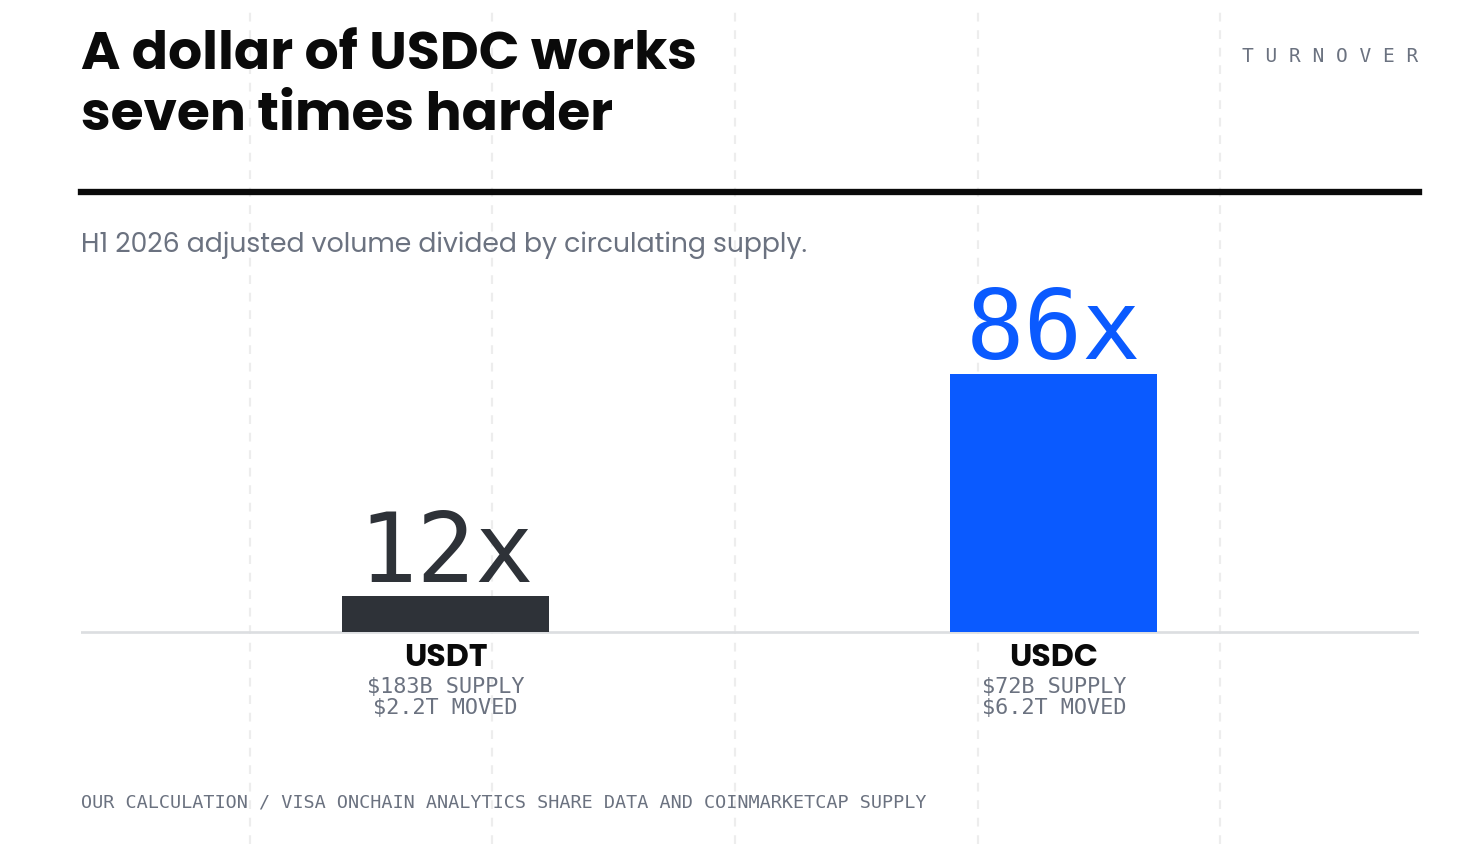
Run the arithmetic on H1 2026 (our calculation, using Visa's share data against current supply):
| USDT | USDC | |
|---|---|---|
| Supply | ~$183B | ~$72B |
| Share of adjusted H1 volume | ~25% | ~70% |
| Implied H1 volume | ~$2.2T | ~$6.2T |
| Turnover vs. supply | ~12x | ~86x |
A dollar of USDC moved roughly seven times more often than a dollar of USDT in the first half of this year.
That is not a rounding artifact or a temporary flow. It is the signature of two different products that happen to share a category name and a peg.
One is Savings, the Other is Settlement
USDT is, increasingly, a savings instrument. An estimated two-thirds of global stablecoin supply sits in emerging markets, held as a dollar hedge against local currency risk, capital controls, and inflation.
Money held for that purpose is not supposed to move. It is supposed to sit there and still be worth a dollar next year.
The chain data makes the point better than any narrative can.
Tron carries roughly $90 billion in stablecoins, of which about $85 billion is USDT, over 97% of the chain's stablecoin liquidity in a single asset. That is not a settlement network. That is a vault with an internet connection.
USDC is going the other direction, hard.
It is natively supported on more than 35 blockchains as of late June. Standard Chartered and BNY have both added USDC-linked services, giving institutional clients digital-dollar settlement without building their own rails.
Circle reported $21.5 trillion in on-chain USDC volume in Q1 2026 alone, up 263% year over year, against end-of-quarter circulation of $77 billion. That is the unadjusted figure, but the ratio still tells you what the asset is being used for.
Which raises the question the league tables can't answer: if these are different businesses, why are we ranking them against each other on a metric that only flatters one of them?
Two Reasons to Be Careful With This Data
The number depends on who is counting.
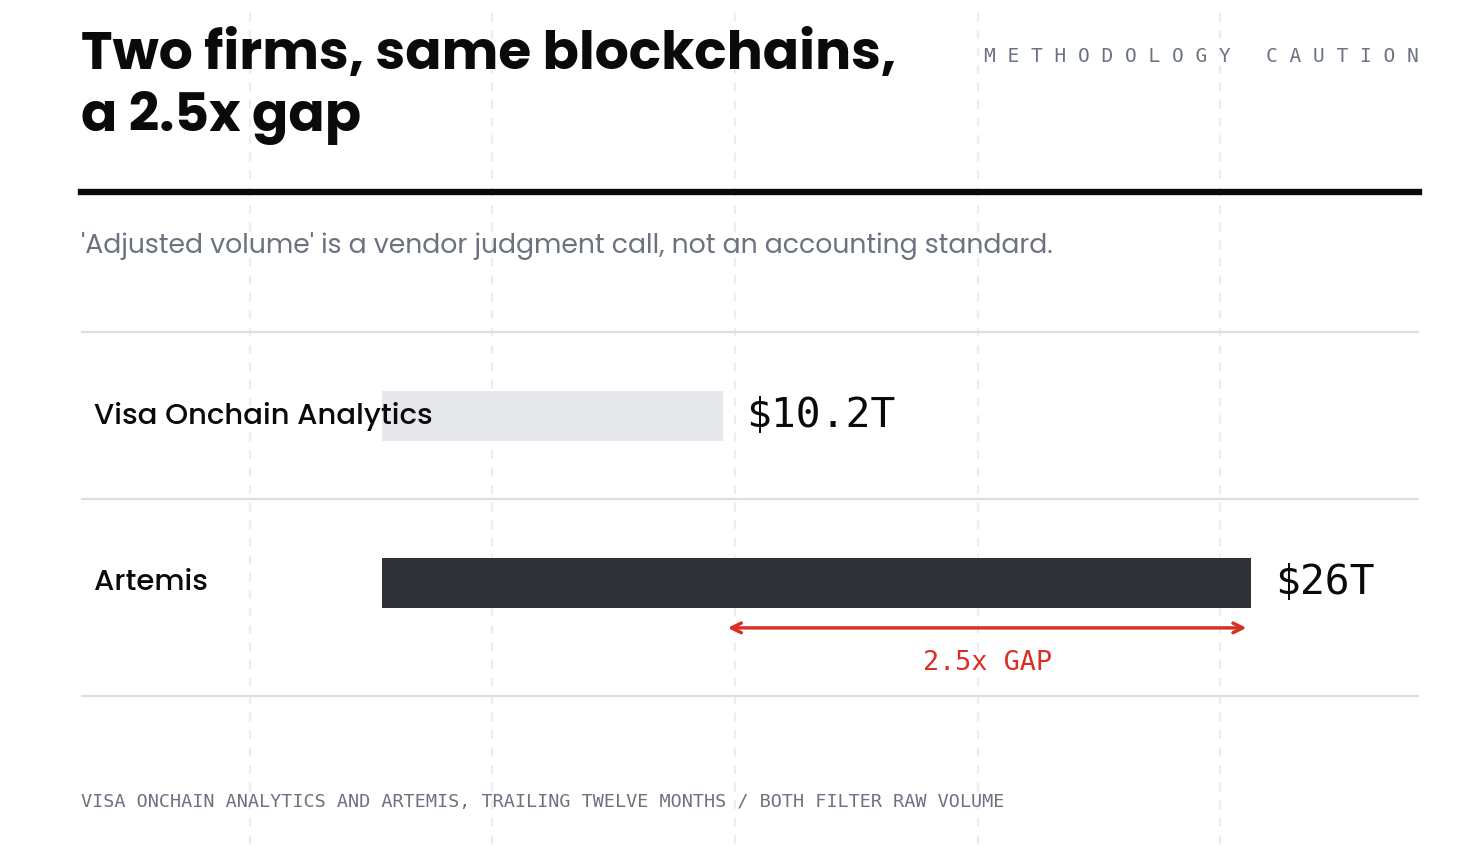
Visa reports roughly $10.2 trillion in adjusted volume over a trailing twelve months. Artemis, running a different methodology on the same underlying chains, lands closer to $26 trillion.
Neither is wrong.
"Adjusted volume" is not a standardized accounting concept. It is a vendor's judgment call about which transfers are real, and reasonable firms disagree by a factor of two and a half.
Visa is not a neutral scorekeeper.
Since December 2025, Visa has settled VisaNet obligations in USDC over Solana through partner banks Cross River and Lead Bank.
That pilot reached roughly $7 billion annualized by April 2026. Visa operates the dashboard that shows USDC winning, and Visa is a participant in USDC settlement infrastructure.
That does not make the data false. It does mean you should want a second source before treating it as gospel, and it is a disclosure the coverage of these figures consistently omits.
Which Number You Should Actually Use
Market cap tells you how much dollar-denominated demand an issuer has captured. That is the number that matters if you are Tether, because supply parked in T-bills earns yield whether it moves or not.
The company posted $1.5 billion in operating profit for Q2 2026 on essentially flat supply.
Volume tells you which asset is embedded in payment flows. That is the number that matters if you are trying to work out which token banks, payment processors and corporate treasuries will still be using in 2030, and which one regulators will eventually treat as systemically important payment infrastructure rather than a store of value.
Rank by supply and you are measuring yesterday's demand. Rank by adjusted volume and you are measuring tomorrow's dependency. The consensus scoreboard has been reporting one and letting readers believe it says something about the other.
What to Watch Next
- Circle's supply target. Circle is aiming at $150 billion in USDC supply in H2 2026, up from roughly $112 billion earlier this year. If it gets there without volume growing proportionally, the velocity gap narrows and the thesis weakens.
- The Q3 Visa print. June's 63% month-on-month jump is a big single-month move. One month is not a trend; three would be.
- Whether USDT's share stops falling. From 90% to 25% over six years is a slide, not a fluctuation. The interesting question is where it finds a floor, and whether that floor is set by the size of the emerging-market savings demand holding it up.
Opportunities of the Month
Agentic Commerce Report
- In October, we are launching the Agentic Commerce Report, to span on products and stablecoin usage. Contact us below to be featured and be a Partner of the Report.
1 Free AI Audit
- Our team will conduct an in-depth review of your site, taking into account technical, on-site, off-site, AI visibility, and positioning, in order to improve the volume of inbound leads your company receives from search engines.
3 Founder Interviews
- Publish a featured interview of your founder on Stablecoin Insider to boost AI and Google visibility, along with a PR Release and Newsletter mention.
Related Reports
Partner/Advertise with Stablecoin Insider
Fill out this form to partner and advertise on the only publication, dedicated entirely to the Stablecoin ecosystem.
See you next week,
- The Stablecoin Insider team