
Table of Contents
A protocol-by-protocol, year-in-review analysis of where stablecoin credit is actually happening, and why.
Stablecoin lending has quietly become one of the most measurable real finance loops in DeFi: deposit stablecoins, borrow stablecoins, hedge, lever, market-make, arbitrage, and recycle liquidity, at global scale, with onchain collateral enforcement.
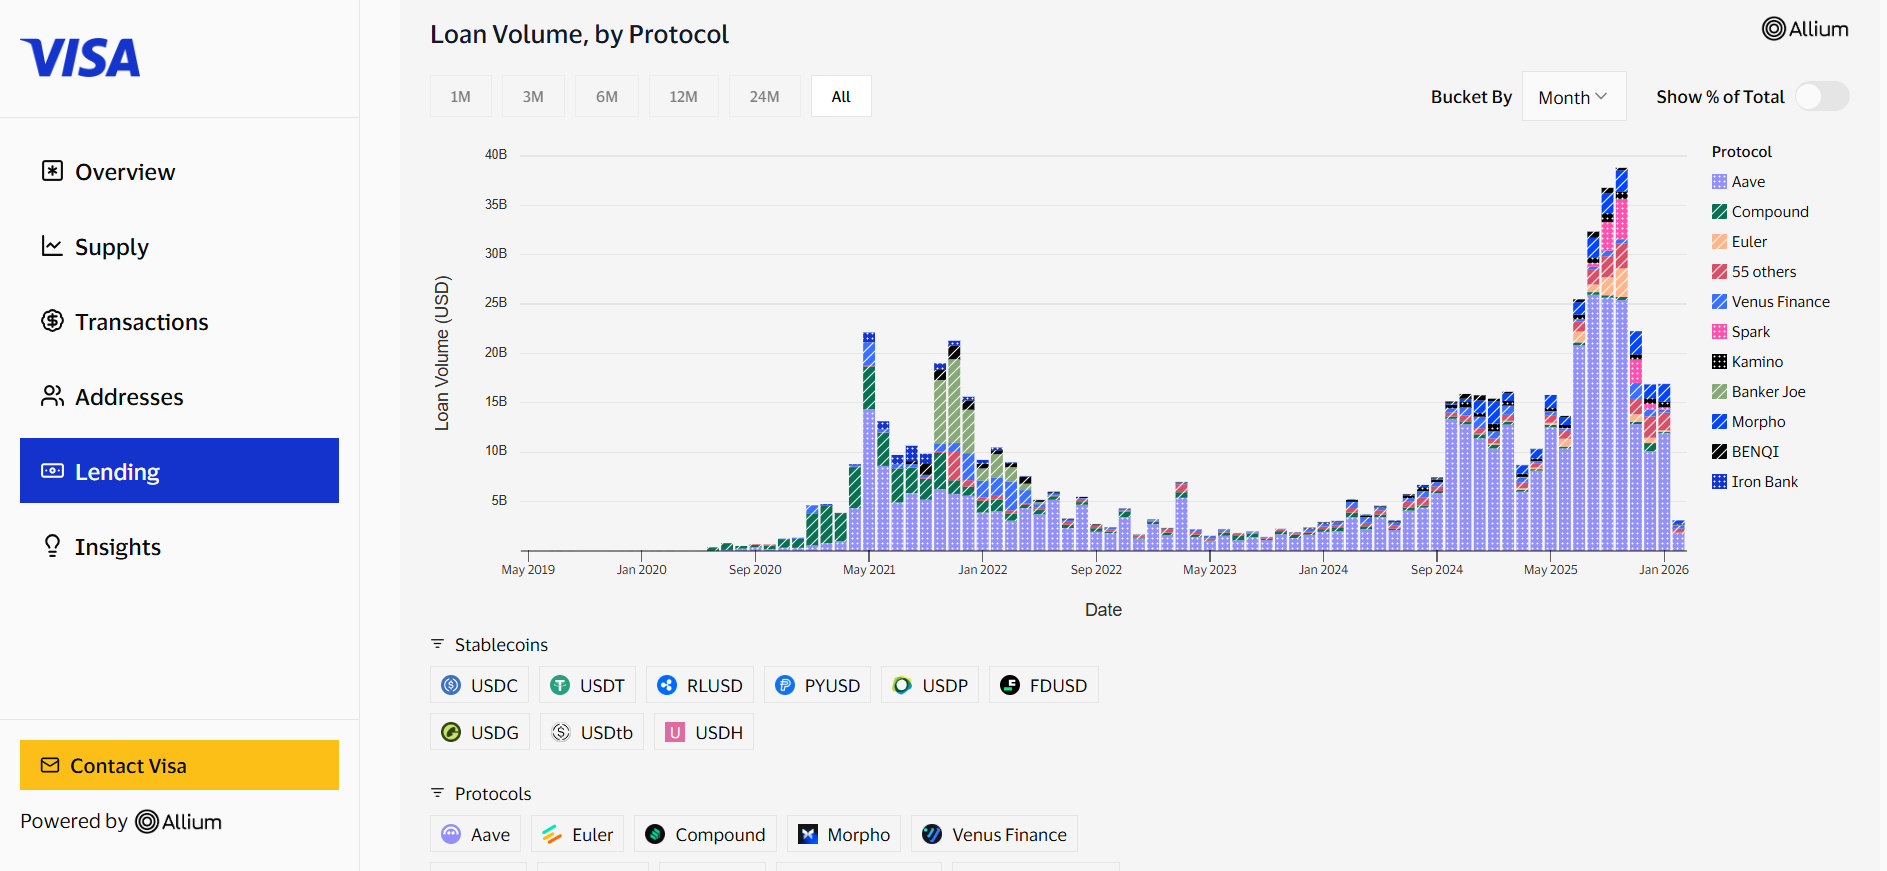
Visa’s onchain analytics work with Allium frames this market in concrete terms (borrowed USD, total borrows, average loan size), and the dashboard shows how concentrated stablecoin credit still is in a handful of venues.
In 2026, the winners aren’t only the biggest TVL protocols. The most important lens is stablecoin loan volume (flow) and how each platform structured risk, integrations, incentives, and distribution so that stablecoin liquidity keeps cycling through its markets.
Key Takeaways
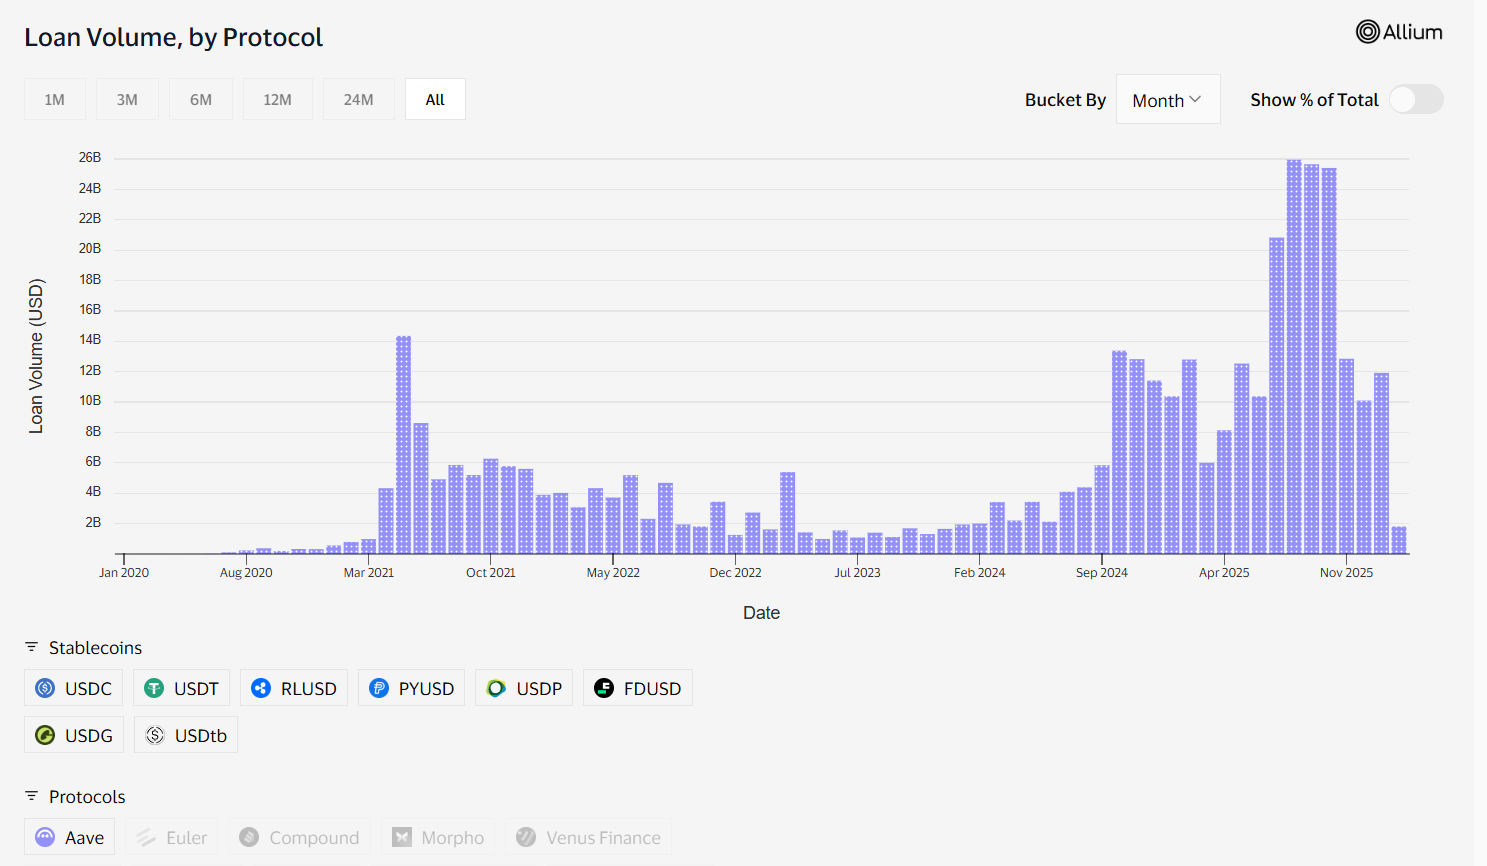
- Aave remains the stablecoin credit backbone by volume in 2026, with $12.44B in loan volume and an outsized share of day-to-day outstanding loan balances.
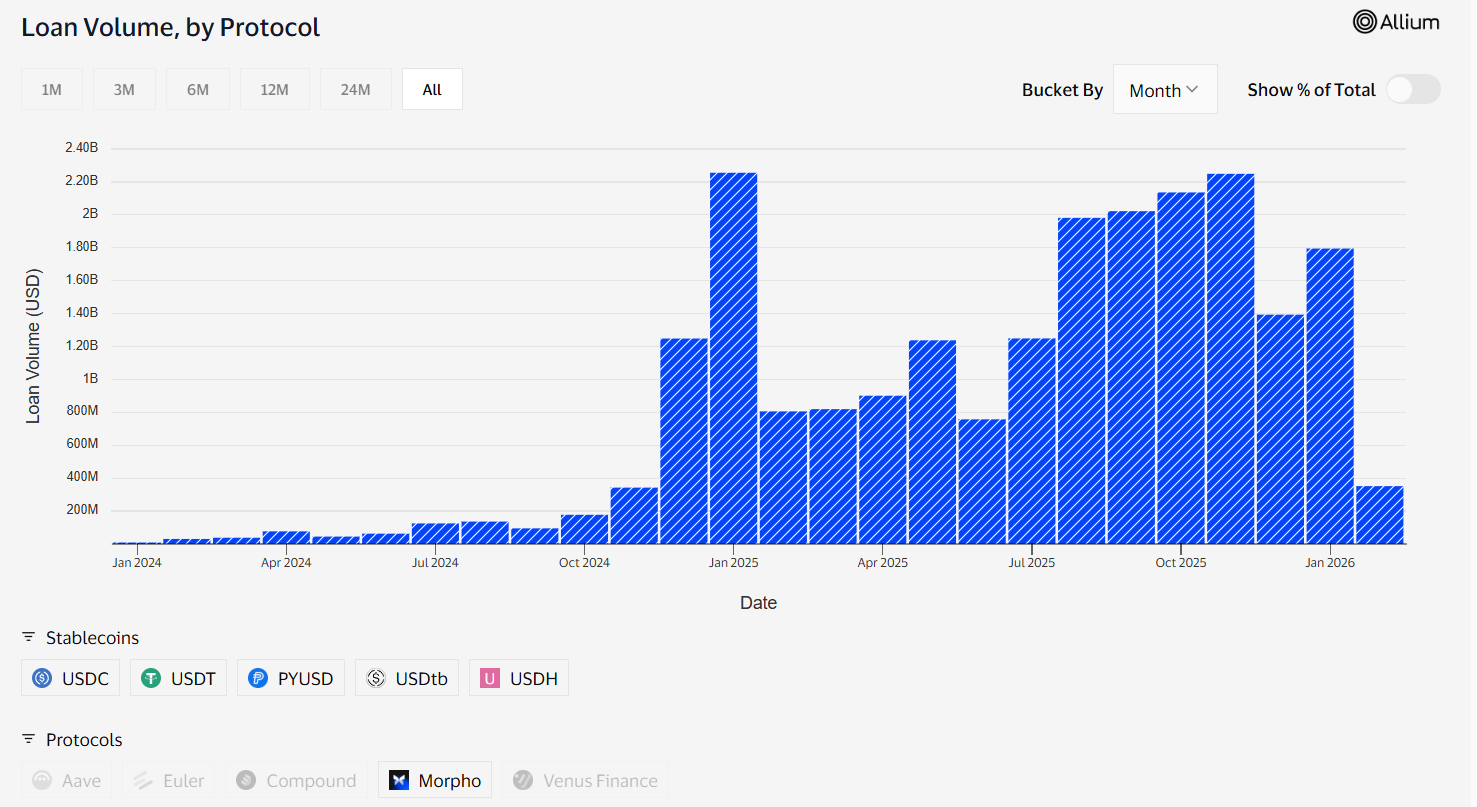
- Morpho is the modular curator layer, less one unified money market, more vaults + curated markets, reinforced by its 2026 roadmap centered on V2 and market-driven pricing.
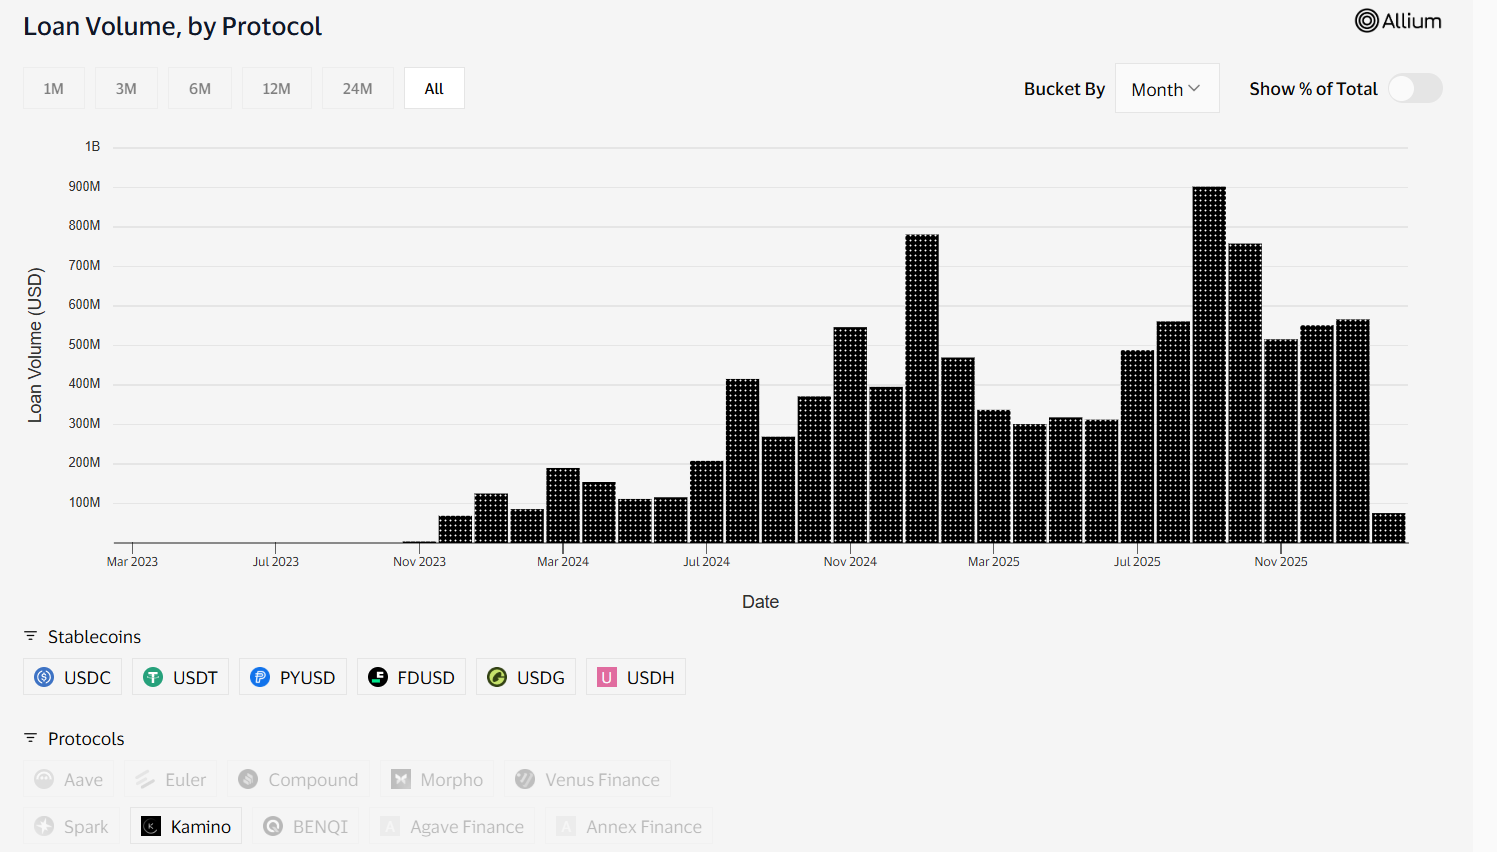
- Kamino and Jupiter both pushed lending productization (vault design, routing/distribution, UX), with Kamino positioning around modular credit infrastructure.
- Spark turned stablecoin liquidity reserves into distribution, notably via PayPal’s PYUSD vault + SparkLend integration path, blending TradFi brand distribution with DeFi rate rails. (coindesk.com)
Best Stablecoin Lending Platforms in 2026:
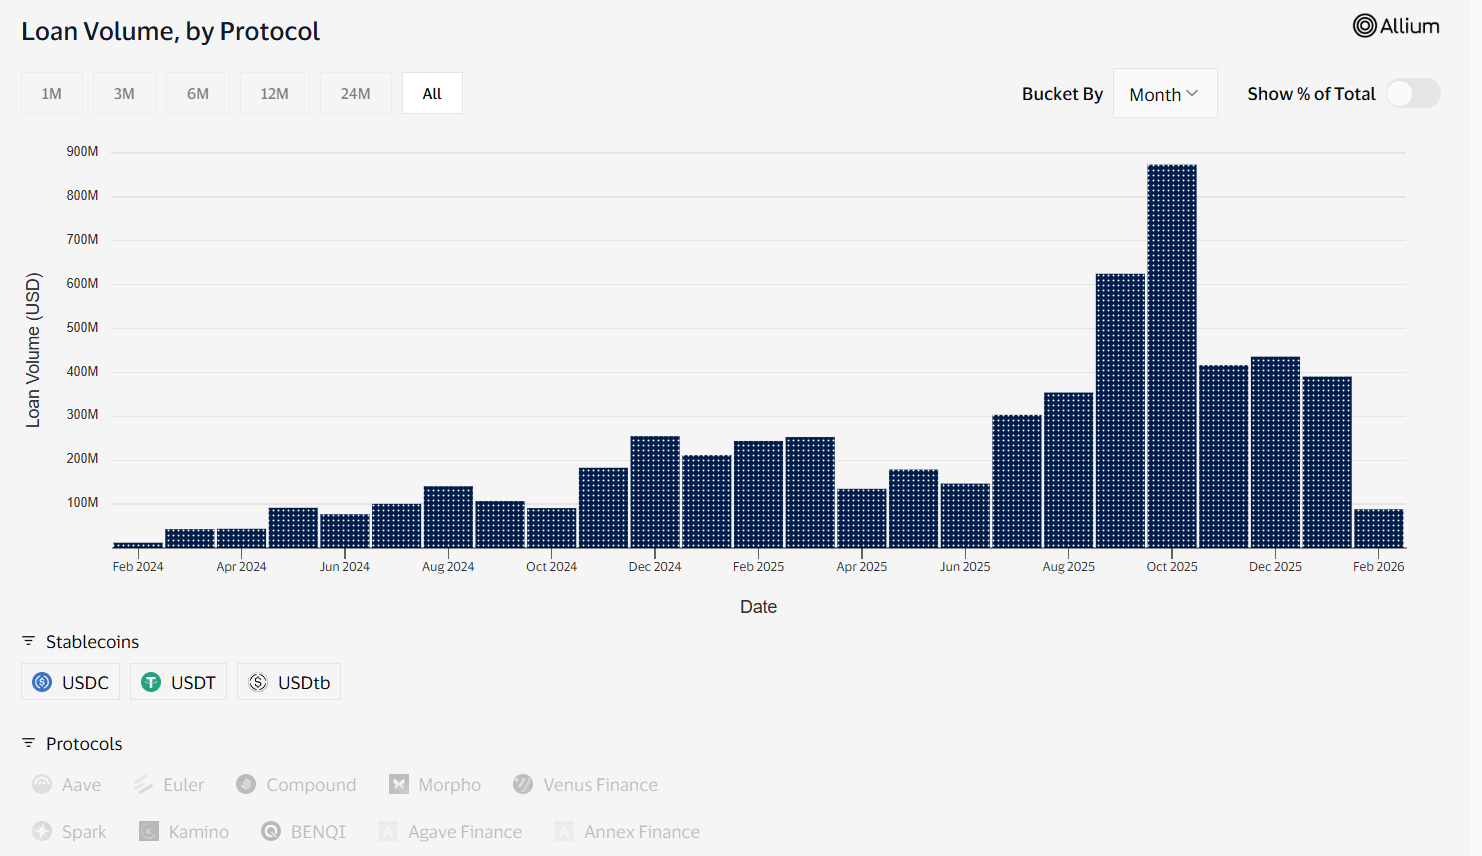
1) Aave
2026 Performance:
- 2026 loan volume: $12.44B
- 2026-01-14 outstanding: $810.44M
Additional Aave metrics (scale, activity, and rate environment)
To put that stablecoin lending dominance in context, Aave’s broader balance-sheet and cashflow metrics underscore why it remains the default credit venue:
- $1B total interest paid (a direct market price signal for how much borrowers paid to access liquidity).
- $3.23T cumulative deposits and $919B total originated loan volume, highlighting the platform’s long-run throughput.
- $52.50B net deposits supplied across 12+ networks, reinforcing that Aave’s liquidity base is meaningfully multi-chain.
- $111.56B volume over the past 30 days, which matters because stablecoin lending volume typically correlates with sustained onchain activity.
- Ethereum network (past year): 3.46% average stablecoin supply APY and 6.01% average stablecoin borrow APR
Simple but powerful way to frame what it cost to borrow stablecoins and what it paid to supply them over a full cycle.
Aave’s stablecoin strategy is also inseparable from GHO, its decentralized stablecoin powered by Aave.
Two metrics matter operationally: a ~245% average collateralization (30-day avg) and 360,608,995 GHO minted (1-year), both of which reinforce that Aave’s lending system increasingly includes its own endogenous stablecoin loop, not only USDC/USDT demand.
Where Aave’s stablecoin credit actually routes
Visa/Allium’s lending table highlights how Aave’s stablecoin loan volume is not one market, it’s a multi-chain, multi-stablecoin routing surface:
- USDT / Ethereum / Aave: $73.0B loan volume (last-12-months view) with 141.4k loans
- USDC / Ethereum / Aave: $50.7B with 153.4k loans
- USDC / Base / Aave: $33.8B with 526.9k loans
These top lanes show: (1) Aave remains core on Ethereum, and (2) distribution on L2s (e.g., Base) turns into very high loan counts (smaller average sizes, more retail/active strategies).
2025–2026: notable upgrades, distribution moves, and integrations
Aave’s 2025 year-in-review positions 2025 as a major growth year, including reaching a peak and ending year with very large deposits, signaling broad liquidity depth that directly supports stablecoin borrowing capacity.
In parallel, Aave governance discussions show continued focus on roadmap execution (including V4, cross-chain liquidity architecture ideas, and broader product direction), which matters because stablecoin credit is increasingly cross-chain by default.
Research coverage also frames Aave’s 2026 direction around evolving from just a money market toward on-chain credit infrastructure (including the strategic role of GHO). (21shares.com)
Lending design: why Aave stays sticky for stablecoin flows
- Risk compartmentalization: Aave’s V3-era concepts (efficiency mode, isolation mode) helped scale correlated-asset borrowing while bounding tail risk.
- Deep collateral menu: Aave’s ability to list and manage a wide collateral set matters because stablecoin loans are usually collateralized by majors (ETH/LSTs/BTC wrappers) and increasingly by L2-native assets.
- Liquidation and oracle maturity: stablecoin lending at scale is mostly a risk-engineering problem (oracles, LT/LTV, liquidation bonuses, caps).
2026 watchpoints (what could change Aave’s share)
- Cross-chain liquidity abstraction (if executed well) can expand Aave’s single market feel across networks.
- Competition moves up the stack (Morpho vault curation, Spark distribution, Solana UX leaders) could siphon marginal stablecoin credit flows even if Aave stays #1.
2) Morpho
2026 Performance
- 2026 loan volume: $1.84B
- 2026-01-14 outstanding: $62.49M
Additional Morpho metrics (deposits and loans)
Morpho’s scale in 2025–2026 is best captured as a curated-lending balance sheet:
- Deposits: $9,406,633,093
- Loans: $3,493,297,778
This deposits vs. loans split is one of the cleanest proxies for utilization and liquidity buffer, the larger the buffer, the more capacity Morpho can keep available for stablecoin borrowers without pushing rates into runaway scarcity.
What Morpho is, in 2026 terms: "curated credit” rather than “one money market”
Morpho’s own 2026 roadmap explicitly centers on Morpho V2 and the idea that markets (not the protocol) define pricing, pushing lending toward a modular, market-driven structure.
Morpho also advanced a vault layer concept (Vaults V2) designed to let curators allocate across Morpho markets and future versions.
Where Morpho’s stablecoin credit concentrates
Visa/Allium’s table shows one of the clearest single lane indicators:
- USDC / Ethereum / Morpho: $10.2B loan volume (last-12-months view), 43.1k loans
This suggests Morpho’s activity clusters around high-signal, high-quality stablecoin collateral/borrow loops on Ethereum, consistent with curated vault behavior: fewer lanes, more intentional risk selection.
2025–2026 integrations and ecosystem moves that matter for lending
- Cronos + Crypto.com collaboration (2025): a distribution-aligned partnership aimed at expanding DeFi lending and tokenization opportunities. For stablecoin lending, this is about distribution + new user rails, not just tech. (blog.cronos.org)
- Rewards / incentives plumbing: Morpho documentation formalizes reward program integration (relevant because lending share often follows incentives). (docs.morpho.org)
Lending design: Morpho’s edge
- Curation as a product: In mature markets, users don’t want every asset, they want safe, composable, curated exposures (USDC vaults, conservative collateral sets, institution-friendly risk).
- Vault abstraction: makes integrations easier, wallets, front-ends, and earn programs can integrate vault shares rather than manage a complex market map.
2026 watchpoints
- Execution risk on V2: market-driven pricing and permissionless composition are powerful, but can introduce new failure modes if curation and guardrails don’t keep pace. (morpho.org)
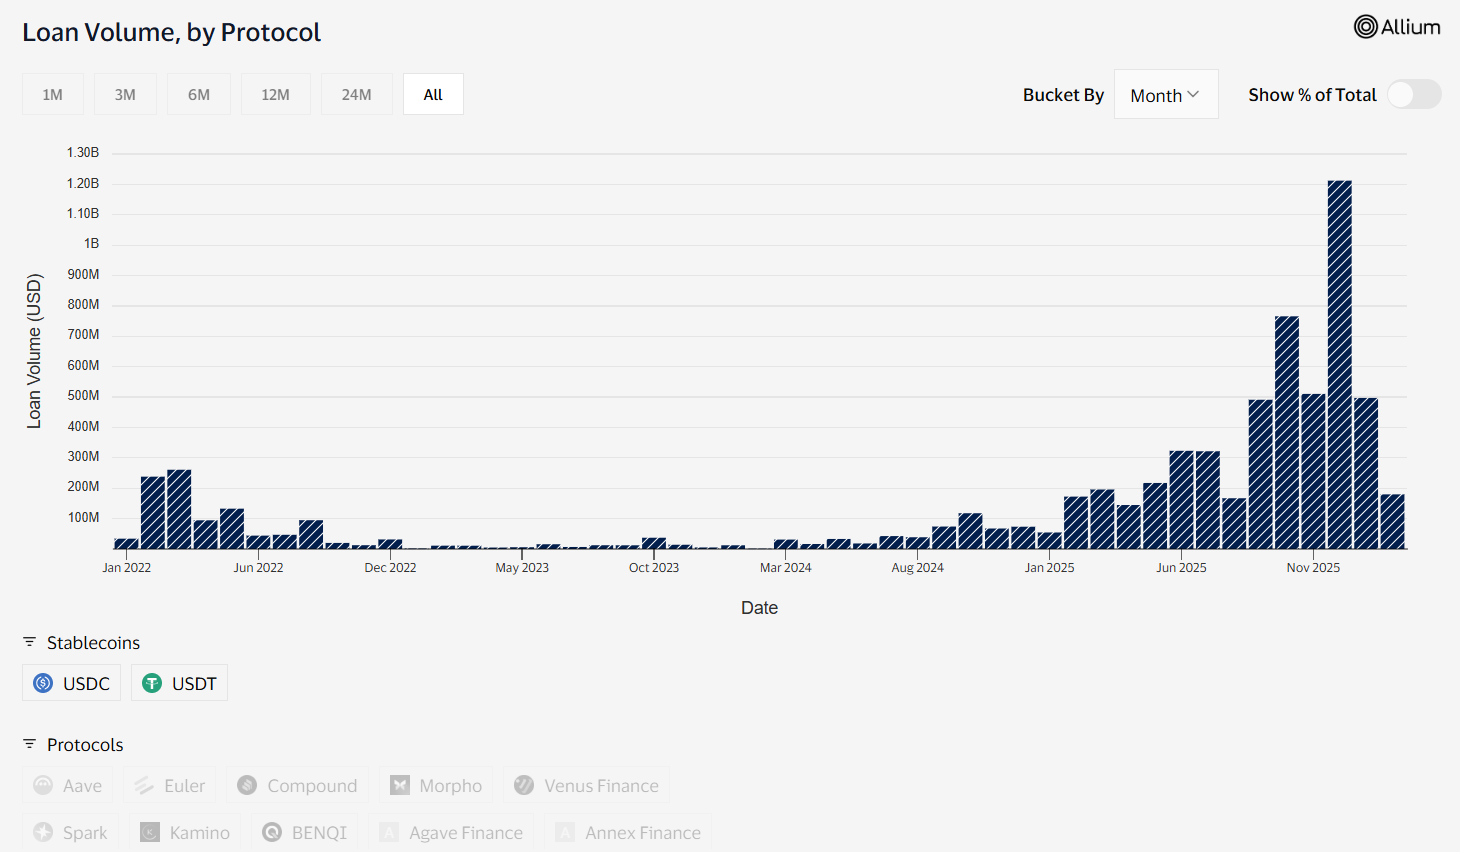
3) Kamino
2026 Performance
- 2026 loan volume: $580.88M
- 2026-01-14 outstanding: $37.84M
Additional Kamino metrics (market size and vault behavior)
Kamino’s lending footprint is best understood as both market depth and vault adoption:
- Market Size: $2,885,034,592
- Vault Deposits: $621,682,008
The vault deposit figure is particularly meaningful in Solana markets because it indicates how much capital is being funneled through structured strategies/managed allocations rather than only point-and-click supply/borrow.
Kamino’s 2025–2026 story: Solana’s credit stack goes modular
Kamino’s Lend V2 positioning is explicitly about modular credit infrastructure on Solana, including advanced credit products and RWA integration direction.
Governance context also points to risk and data integrations (e.g., Chainlink data streams), which is not marketing fluff, it’s the backbone of safe liquidation and accurate collateral pricing.
Where Kamino’s stablecoin credit shows up
Visa/Allium’s table surfaces:
- USDC / Solana / Kamino: $4.1B loan volume (last-12-months view), 217.4k loans
That loan count is a key signal: Solana lending trends toward high transaction count behavior, which usually means (a) smaller average positions, and/or (b) more active looping/strategy usage.
Integrations and product moves that matter for lending (2025–2026)
- Modular lending upgrade (Lend V2): framed as a major step forward for Solana lending product design. (rockawayx.com)
- Risk contributors + data streams: governance posts highlight structured risk operations and data feed upgrades. (gov.kamino.finance)
Lending design: Kamino’s edge in Solana markets
- Solana-native UX + throughput: Solana’s low latency encourages frequent collateral management, rebalancing, and liquidation efficiency.
- System design approach: Kamino’s infrastructure layer framing matters because lending growth in 2026 is increasingly about being the default backend for other apps (wallets, earn vaults, strategy routers).
2026 watchpoints
- Collateral quality / oracle robustness: fast chains amplify both good (tight spreads) and bad (fast liquidations in stress). Risk engineering remains the differentiator.
4) Fluid
2026 Performance
- 2026 loan volume: $401.40M
- 2026-01-14 outstanding: $19.80M
Additional Fluid metrics (lending base and supply depth)
Fluid’s lending activity sits on top of a large liquidity base:
- Total Lendings: $534,382,966
- Liquidity Total Supply: $1,482,851,482
That spread matters: a larger supply base can absorb borrow demand and volatility without forcing rate spikes, which is crucial for stablecoin borrowers who often refinance and roll positions frequently.
Fluid’s core idea: collapse DEX + lending into one capital-efficient system
A major part of Fluid’s narrative is that its architecture links borrowing/lending with trading liquidity, so collateral/debt can be used to enhance DEX liquidity and swap fees can reinforce supply/debt dynamics.
That is directly relevant to stablecoin lending because it increases capital efficiency per dollar of stablecoin liquidity. (mixbytes.io)
Messari coverage frames 2025 as a validation year for Fluid’s DEX volumes and notes protocol-level mechanisms like reserves and buybacks, signals of maturing economic design.
2025–2026 integrations and expansion
Reports and announcements point toward multi-chain deployment ambitions (including BNB Chain collaboration mentions), which matters because stablecoin lending volume follows the largest stablecoin distribution rails.
Lending design: why Fluid is different
- Smart collateral / smart debt concepts: the key is net capital efficiency, how many productive activities (swap LP, borrow, supply) can one unit of collateral support safely.
- Integrated venue advantages: in theory, integrated DEX + lending can reduce idle liquidity and improve utilization.
2026 watchpoints
- Complexity risk: integrated systems can create new contagion pathways if risk parameters don’t account for correlated shocks across lending + DEX liquidity.
5) neverland
2026 Performance
- 2026 loan volume: $231.61M
- 2026-01-14 outstanding: $17.12M
What neverland is trying to be
Public descriptions position neverland as a Monad-native lending protocol with ve-tokenomics, self-repaying loans, and automated yield strategies.
Additionally, Chainlink’s ecosystem listings indicate data feed support for neverland, important for any lending protocol that wants credible collateral pricing and liquidation triggers.
2025–2026 integrations and updates: what’s publicly verifiable
For neverland specifically, the publicly-documented set of 2025–2026 integrations is thinner than for the large incumbents.
What is verifiable at ecosystem level:
- Protocol identity and feature direction (Monad-native, veTokenomics, self-repaying loans).
- Oracle/data feed ecosystem presence via Chainlink’s ecosystem index.
Lending design: the bet neverland is making
- Incentive-driven debt reduction (self-repaying loans concept): aligns governance rewards/fees with reducing borrower debt over time.
- veTokenomics as distribution: if users can direct revenue and incentives, credit flows can be steered to chosen pools/markets.
2026 watchpoints
- New chain liquidity realities: lending is ultimately a liquidity depth game. New ecosystems can grow fast, but they’re more sensitive to large position concentration and oracle/market microstructure.
6) Euler
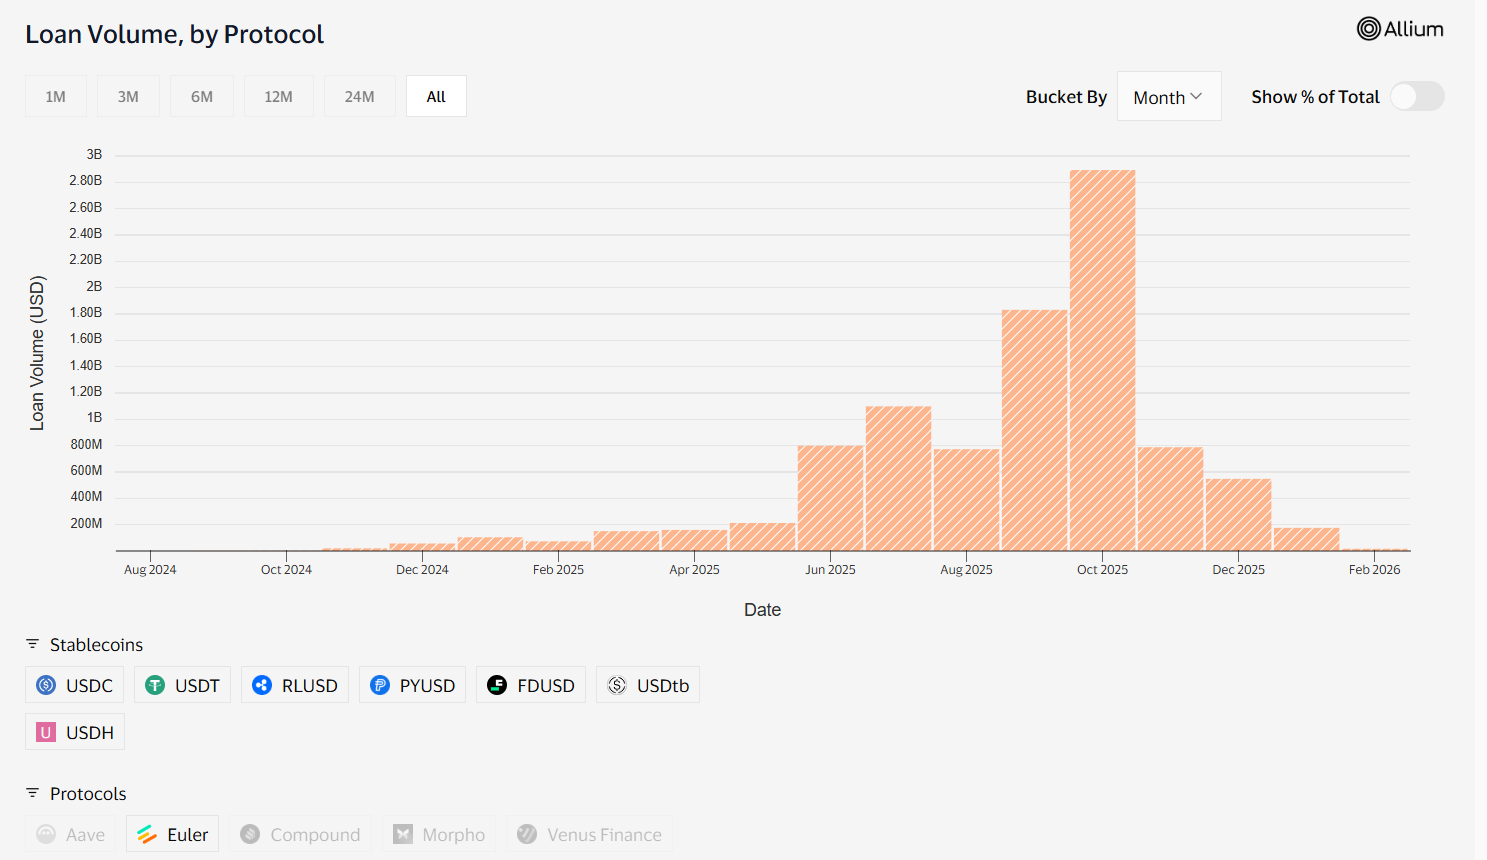
2026 Performance
- 2026 loan volume: $185.03M
- 2026-01-14 outstanding: $15.39M
Euler’s comeback arc matters for stablecoin lending credibility
Euler’s re-emergence is closely tied to risk governance and institutional-grade risk operations.
Euler’s official update highlights Gauntlet aligning to manage risk for flagship markets, this is the kind of operational signal that can re-attract stablecoin lenders after historical trust shocks. (euler.finance)
Broader market commentary notes share recovery around Euler V2 after relaunch, emphasizing regained confidence.
Where Euler’s stablecoin credit shows up
Visa/Allium’s table shows:
- USDC / Ethereum / Euler: $3.9B loan volume (last-12-months view), 18.5k loans
2025–2026 product and integration signals (relevant highlights)
Independent research coverage points to Euler’s broader ecosystem productization (e.g., native components like a swap layer in the V2 ecosystem).
Even when you ignore hype, the important point is: Euler’s strategy is to rebuild lending as an ecosystem with better integration surfaces and risk ops, key drivers for stablecoin lenders.
2026 watchpoints
- Trust premium remains expensive: Euler can grow stablecoin lending, but the hurdle rate is higher, users demand stronger risk governance signals than they do from never-hacked incumbents.
7) Jupiter
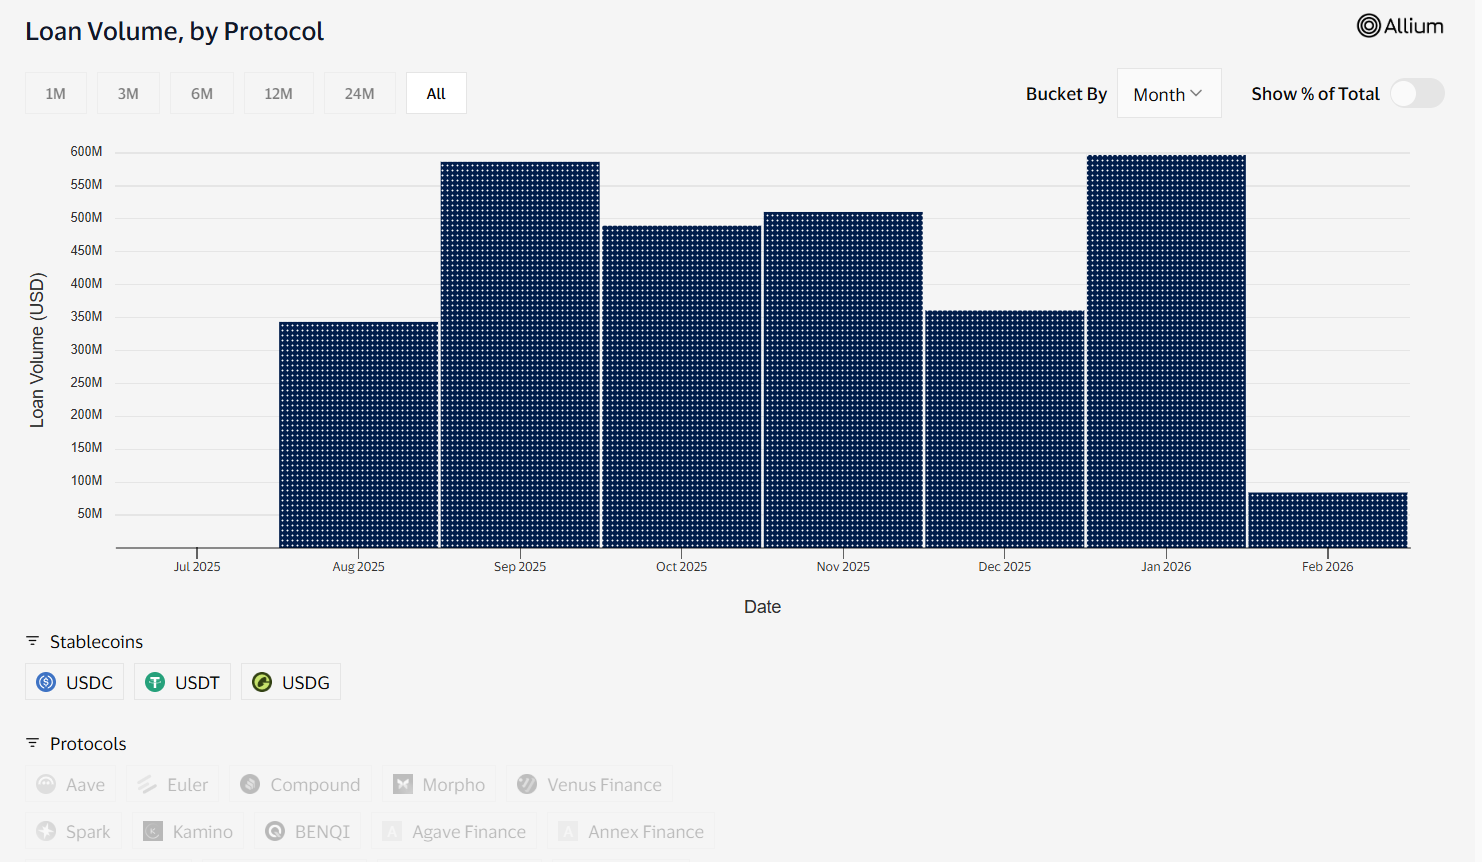
2026 Performance
- 2026 loan volume: $619.01M
- 2026-01-14 outstanding: $13.84M
Additional Jupiter Lend metrics (Solana-native scale)
Jupiter’s money market stats help explain why it earns a top-slot in Solana lending mindshare:
- Total Supply: $1.74B
- Total Available: $1.05B
- Total Borrowed: $682M
Jupiter’s lending angle: distribution + UX, not just “a money market”
Jupiter’s lending product (Jupiter Lend) exists inside a broader Jupiter product suite, and public materials show it as a “borrow against your crypto” vault-driven experience.
Coverage around Breakpoint 2025 indicates Jupiter’s push to bring lending fully out of beta and connect it with broader Jupiter platform launches and roadmap items (including Offer Book / P2P lending direction tied to RainFi acquisition context).
What this means for stablecoin lending flows
Jupiter’s edge is not most conservative risk engine. It’s:
- user acquisition + routing distribution from being a core Solana front-end,
- vault UX that lowers the friction to borrow stablecoins against volatile collateral,
- and potentially P2P credit primitives that expand beyond classic liquidation-based models.
2026 watchpoints
- Risk complexity increases as product breadth increases: offering more collateral types and credit models expands the surface area for stress events.
8) Venus Finance
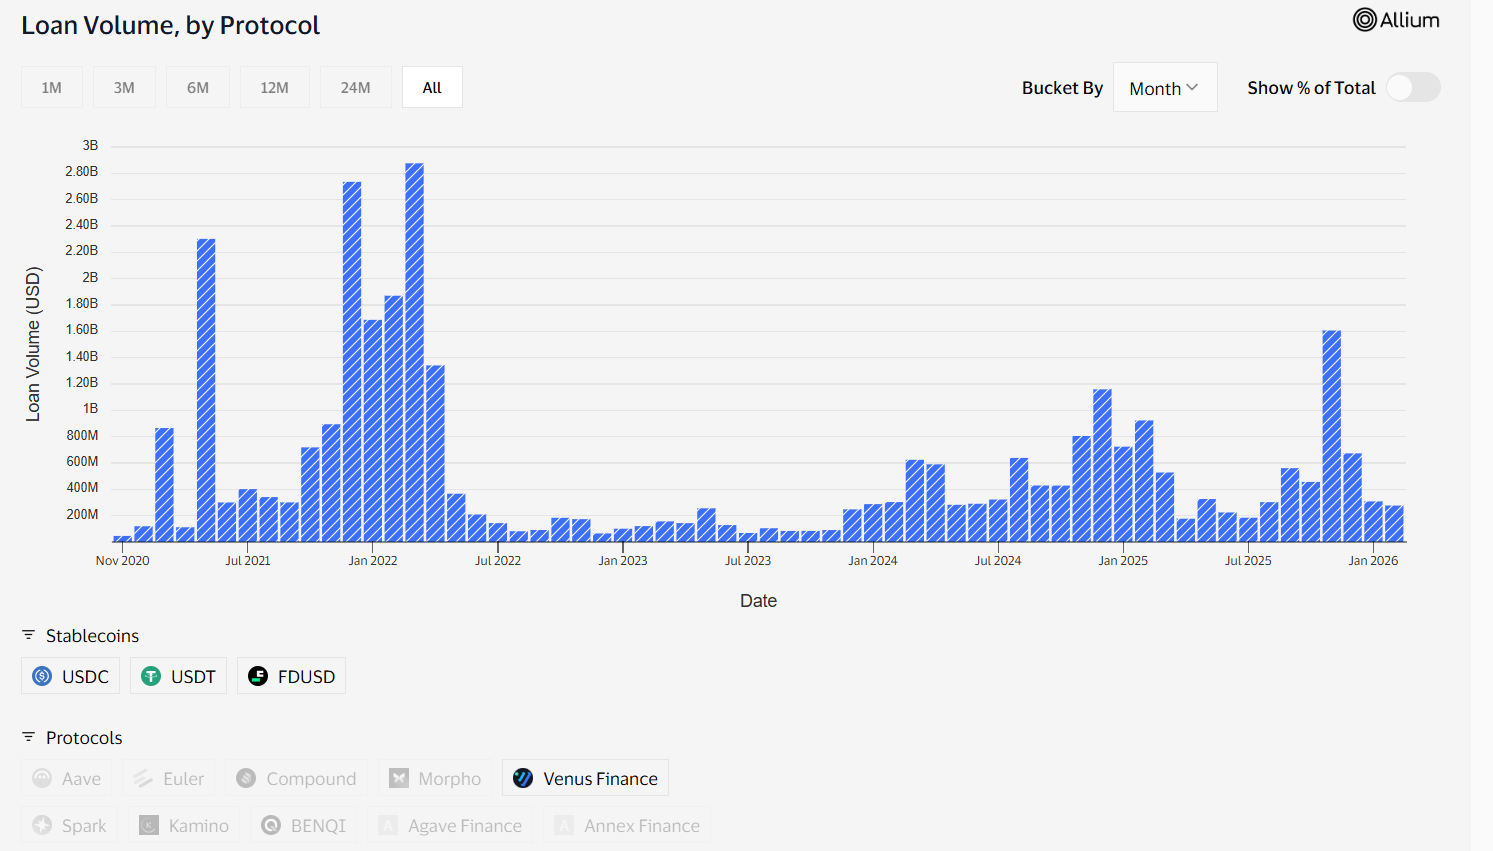
2026 Performance
- 2026 loan volume: $323.60M
- 2026-01-14 outstanding: $9.11M
Additional Venus metric (TVL as a lending capacity proxy)
- Venus TVL: $1,860,208,398
TVL isn’t loan volume, but in overcollateralized lending it functions as a practical proxy for potential borrowing capacity, especially in ecosystems where users loop collateral and borrow stablecoins repeatedly.
Venus is the BNB Chain stablecoin lending workhorse
Visa/Allium’s table surfaces the canonical lane:
- USDT / BSC / Venus Finance: $4.4B loan volume (last-12-months view), 67.3k loans.
This is exactly what you’d expect: BNB Chain + USDT is a high-throughput retail-heavy credit lane.
2025–2026 integration & expansion signals
Venus’ own year-in-review style communication highlights chain expansion/integration moves (example: Unichain integration and deposit growth signals in the early phase).
BNB Chain ecosystem commentary also frames Venus as a key lending venue supporting stablecoins and RWA collateral narratives in that ecosystem. (binance.com)
Lending design: Venus’ durable advantages
- Distribution alignment with BNB Chain: stablecoin credit follows where users already are.
- Retail-scale loan count: the table’s loan count signals many smaller positions
- Fragmentation risk: if BNB lending fragments across more native venues, Venus’ share can dilute even if the ecosystem grows (a theme hinted in broader DeFi market coverage).
9) Maple
2026 Performance
- 2026 loan volume: $407.18M
- 2026-01-14 outstanding: $6.87M
Additional Maple metrics (credit-market positioning)
Maple’s lending profile is better described as structured onchain credit with institution-friendly packaging and speed:
- Assets Under Management: $4.05B
- Amount Borrowed: $19.21B
- Total Borrowers: 100+
- Total Loans Issued: 400+
- Funding Time: 24 hours
These metrics highlight why Maple sits in a distinct bucket: it’s less about permissionless retail looping and more about scaling repeatable credit issuance with predictable operational timelines.
Maple’s lane: onchain asset management and credit product distribution
Maple’s own 2025 data review frames a clear repositioning: starting 2025 as stablecoin yield, entering 2026 as a category leader with expanded product reach and integrations across major platforms and earn programs.
Maple also emphasizes the scaling and distribution of syrupUSDC/syrupUSDT across DeFi integrations and the growth of its AUM, this matters because Maple’s lending isn’t just a money market; it’s credit product packaging + distribution.
Lending design: why Maple behaves differently from Aave/Morpho
- Credit product structure: Maple historically leans toward structured credit and yield products rather than purely permissionless pooled money markets.
- Distribution-first approach: integrations with platforms and earn programs drive stablecoin inflows, which then become lendable capital.
2026 watchpoints
- Asset expansion execution: the more Maple pushes toward any asset / RWA adjacency, the more its risk operations and underwriting narratives must stay extremely crisp to keep stablecoin lenders comfortable.
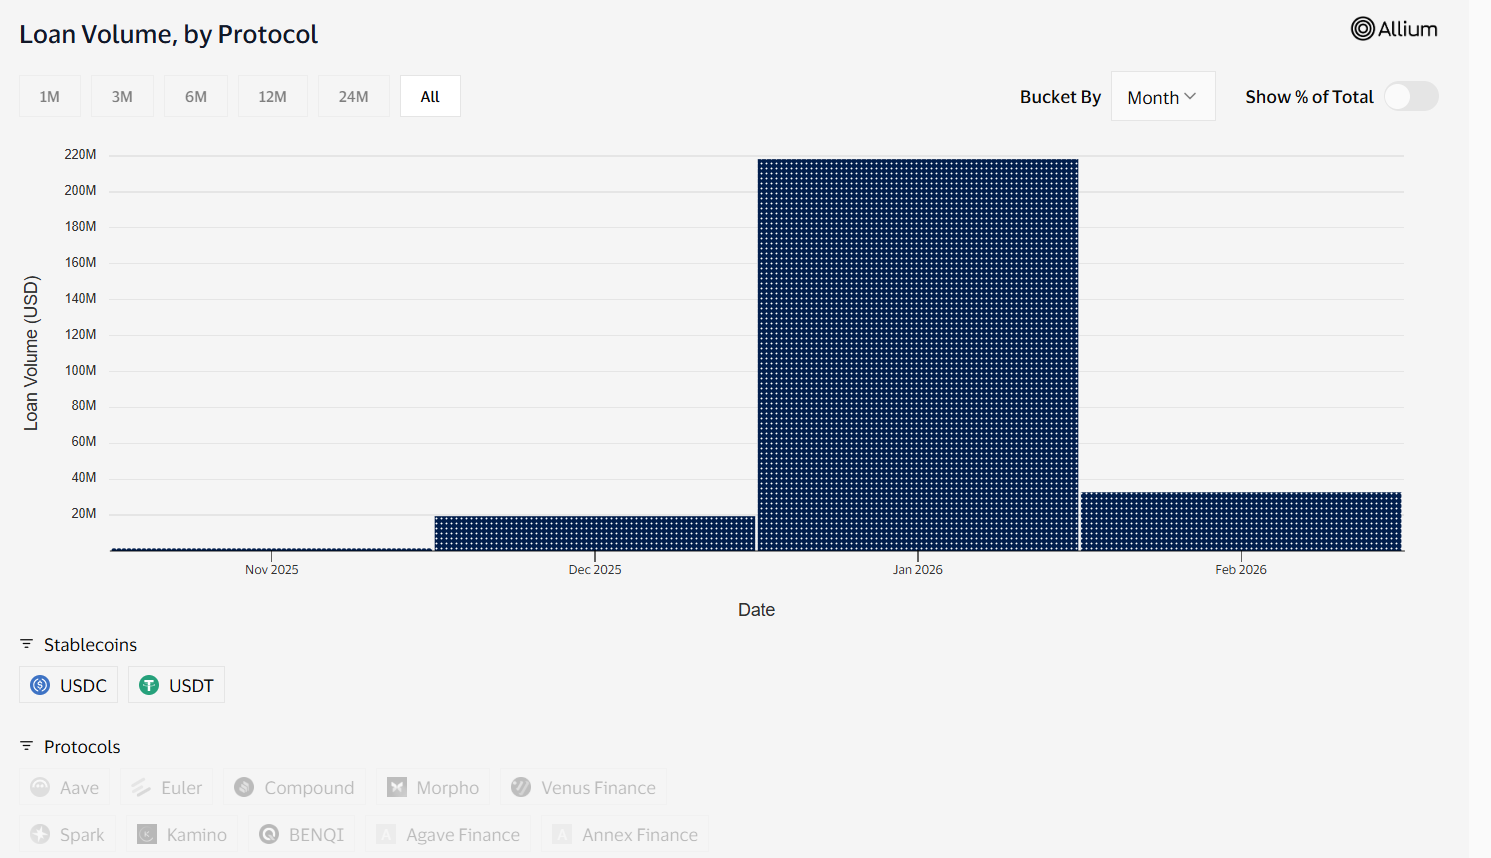
10) Spark
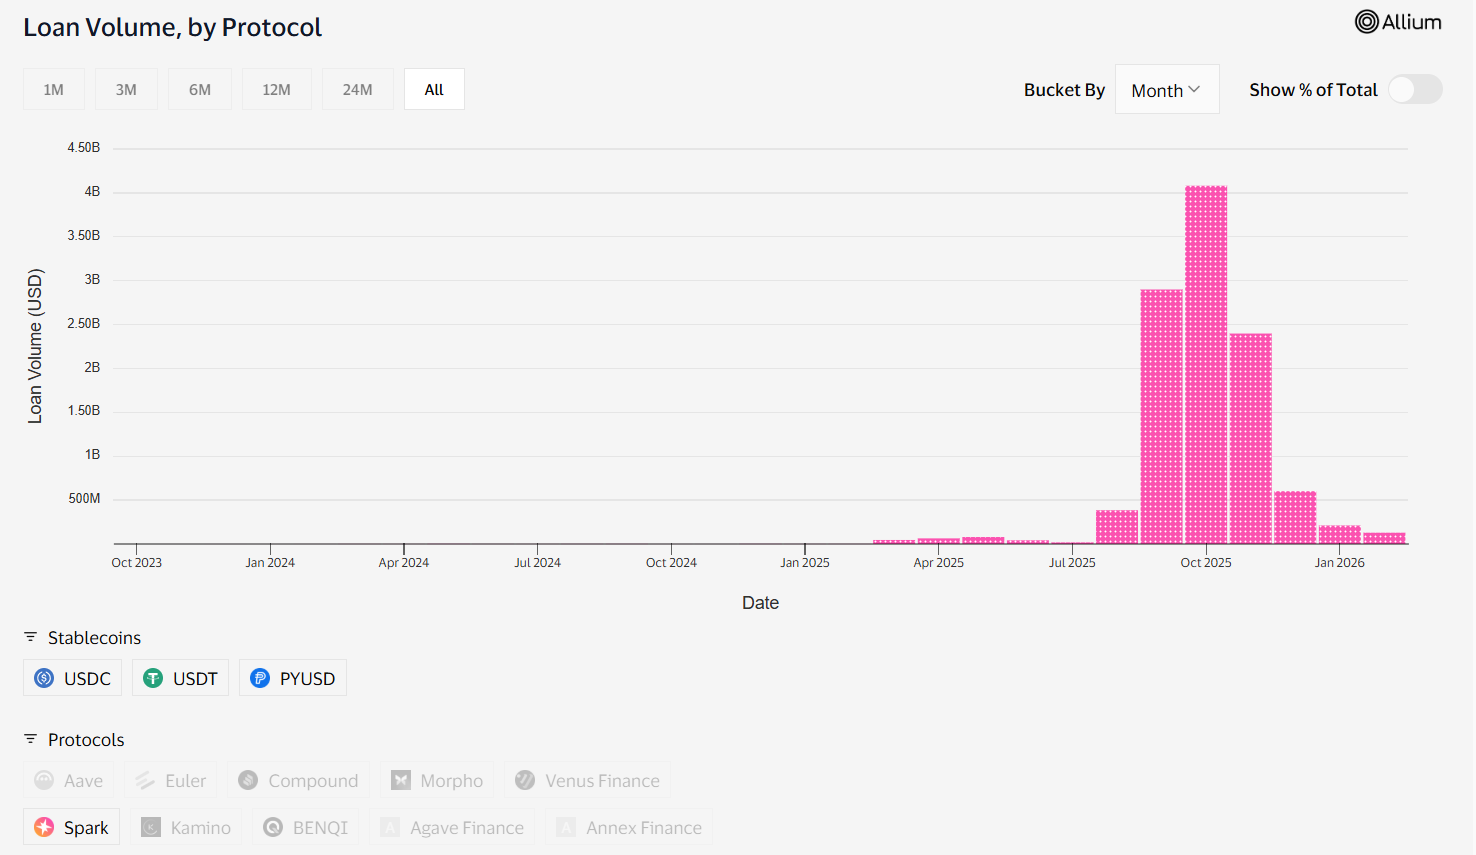
2026 Performance
- 2026 loan volume: $221.00M
- 2026-01-14 outstanding: $3.63M
Additional Spark metrics (three-layer TVL picture)
Spark’s footprint is best understood as a stack of liquidity layers rather than one lending pool:
- SparkLend TVL: $2.48B
- Spark Liquidity Layer: $1.92B
- Savings TVL: $4.74B
Together, these metrics signal a distribution-led design: a savings surface to attract capital, a liquidity layer to route it, and SparkLend as a lending execution venue.
Spark’s differentiator: stablecoin reserves + branded distribution
Spark positions itself around deploying substantial stablecoin reserves to bootstrap liquidity products (i.e., it can “seed” markets without relying on external mercenary capital).
The most important 2025 integration signal for Spark lending is the PYUSD path:
- PayPal tapped Spark to scale PYUSD liquidity via DeFi lending (CoinDesk).
- PayPal launched a PYUSD Savings Vault on Spark, extending PYUSD distribution into DeFi yield rails.
Where Spark’s stablecoin lending shows up
Visa/Allium’s table shows:
- USDT / Ethereum / Spark: $9.8B loan volume (last-12-months view), 2.3k loans.
That combination of a high volume, low loan count, typically indicates larger average positions (more institutional/whale-like behavior) versus Solana-style high-count retail loops.
Lending design: Spark’s advantage
- Liquidity provisioning as strategy: Spark’s model is less dependent on competing for every depositor and more about deploying reserves into targeted products.
- Brand-distribution wedge: PYUSD is the clearest example, Spark becomes the onchain rate rail under a mainstream brand wrapper.
2026 watchpoints
- Concentration and dependency: distribution-led growth can concentrate exposures (a few large vaults, a few large depositors). Risk ops must match the growth story.
Cross-Platform Analysis: What Actually Drives Stablecoin Lending Volume in 2026
1) Distribution beats novelty
Aave (multi-chain depth), Morpho (vault curation), Kamino/Jupiter (Solana UX), Venus (BNB retail rails), Spark (PayPal/PYUSD distribution) all succeed by being in the same place as the users, not by inventing a new liquidation curve.
2) Loan counts reveal the user base
From Visa/Allium table lanes:
- Aave on Base shows very high loan count (active usage).
- Kamino on Solana shows very high loan count (strategy/retail behavior).
- Spark shows low loan count relative to volume (larger positions).
3) Risk operations are the product
Stablecoin lending is simple until volatility spikes. Then it becomes:
- oracle quality,
- collateral caps,
- liquidation throughput,
- bad debt handling,
- governance response speed.
This is why integrations like data feeds, risk managers, and modular vault abstractions are not side notes, they are lending throughput.
Conclusion
Stablecoin lending in 2026 is fundamentally a distribution + risk-operations competition.
The leaders pair deep liquidity buffers with mature oracle/liquidation infrastructure and strong go-to-market channels, multi-chain money markets (Aave), curated vault layers (Morpho), Solana-native UX and throughput (Kamino, Jupiter), ecosystem-aligned rails (Venus), structured credit packaging (Maple), and reserve-backed distribution (Spark).
For readers comparing platforms, the most useful framework is:
liquidity depth, utilization behavior, collateral quality, and operational resilience, then map those to your own use case (treasury yield, active borrowing, market-making, or structured credit exposure).
Read Next:
- Stablecoin Insider Partners with Stablecoin Standard
- Trustless Stablecoins: The Complete 2026 Guide
- The Rise of Stablecoin Savings Apps
FAQs:
1. What is stablecoin loan volume in DeFi lending?
Stablecoin loan volume is the total dollar value of stablecoins borrowed through a protocol over a period of time, showing how much credit activity cycled through its markets.
2. Why does Aave dominate stablecoin lending in 2026?
Aave dominates stablecoin lending in 2026 because it combines deep liquidity, multi-chain distribution, and mature risk controls that keep stablecoin borrowing scalable across market cycles.
3. How is Morpho different from a traditional money market?
Morpho is different because it emphasizes curated, modular vaults and market-driven pricing, letting curators and markets shape risk and rates rather than relying on one protocol-set model.
4. Why do Kamino and Jupiter have so many loans compared to some EVM venues?
Kamino and Jupiter tend to have higher loan counts because Solana’s low latency and UX encourage more frequent position management and smaller, strategy-driven borrowing patterns.
5. What is the biggest risk in stablecoin lending platforms?
The biggest risk in stablecoin lending platforms is collateral volatility combined with oracle or liquidation failures, which can produce bad debt when positions cannot be liquidated fast enough during stress.
Disclaimer:
This content is provided for informational and educational purposes only and does not constitute financial, investment, legal, or tax advice; no material herein should be interpreted as a recommendation, endorsement, or solicitation to buy or sell any financial instrument, and readers should conduct their own independent research or consult a qualified professional.
