
Table of Contents
Stablecoins are now a consumer-behavior story, not just a market-cap story.
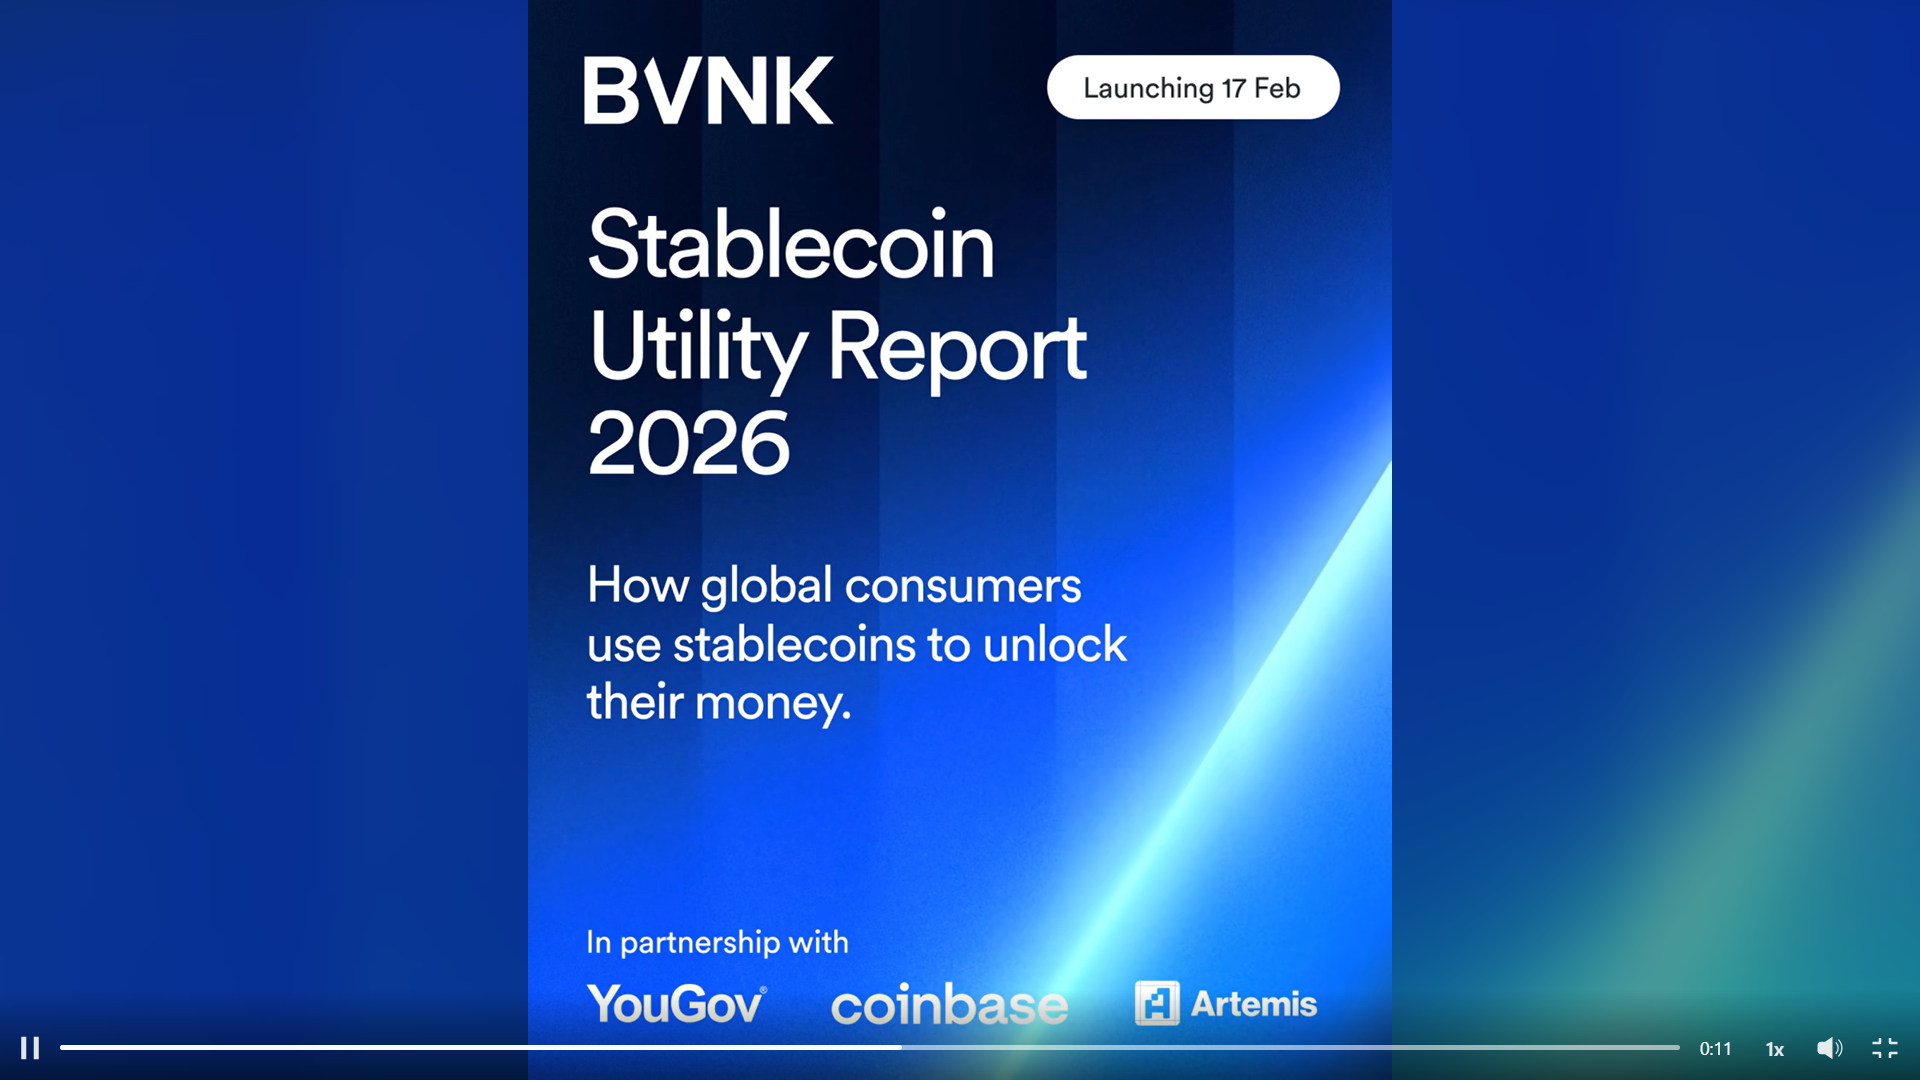
In a YouGov survey commissioned for BVNK’s Stablecoin Utility work, 4,658 adults across 15 countries, each either active in crypto within the last 12 months or intending to acquire in the next 12 months, report stablecoins as a fast-growing part of savings, a practical rail for cross-border income, and (in many markets) a payment method people want to use more than they currently can.
The headline tension is clear: ownership and intent are high, and stablecoins move quickly once acquired, but day-to-day spending still lags demand because acceptance and user experience are not yet normal enough for mainstream habits.
Put differently, the limiting factor is less about whether people see the value and more about whether stablecoins fit into everyday checkout flows with the predictability users expect.
Key Takeaways
- Ownership is high: 54% held stablecoins in the last 12 months.
- Intent is higher: 56% plan to acquire more; 13% plan to start.
- Holdings are rising: 49% increased holdings in the past year.
- Stablecoins move fast: 28% convert or spend within days.
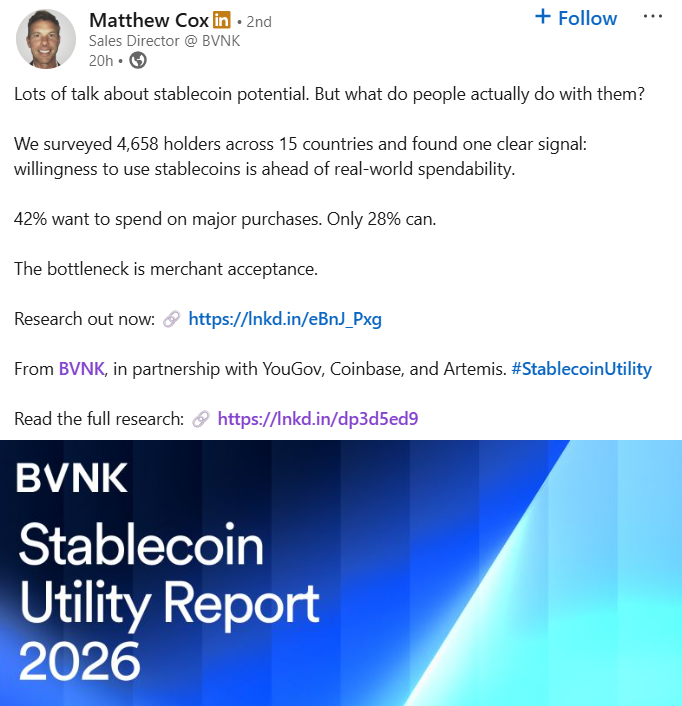
- Spending demand outpaces reality: 42% want major purchases vs 28% today.
- Exchanges lead, banks can win: 46% manage via exchanges; 77% want a bank/fintech wallet.
Methodology And Scope
Survey partner: YouGov
Commissioning context: BVNK (Stablecoin Utility research)
- Sample: 4,658 adults (18+) across 15 countries
- Eligibility: respondents either currently hold / held crypto (including stablecoins) in the last 12 months or intend to acquire crypto (including stablecoins) in the next 12 months
- Fieldwork: online, September–October 2025
- Regional grouping: 7 regions, with comparisons also grouped by World Bank income classifications (high income vs low/middle income)
A key implication of this methodology is that the findings reflect crypto-active consumers (recent holders or near-term acquirers), not the general population.
That makes the results especially useful for product strategy, because they describe behavior among people already inside the adoption funnel.
Country coverage (15 markets, 7 regions)
| Region | Country | Total sample | Hold/held crypto | Hold/held stablecoin | Intend to acquire stablecoin |
|---|---|---|---|---|---|
| Europe | United Kingdom | 320 | 284 | 91 | 22 |
| Europe | France | 240 | 193 | 78 | 28 |
| Europe | Germany | 319 | 264 | 100 | 26 |
| North America | United States | 319 | 284 | 91 | 22 |
| Asia-Pacific | Australia | 320 | 291 | 179 | 26 |
| Latin America | Brazil | 326 | 252 | 118 | 62 |
| Latin America | Argentina | 321 | 259 | 146 | 50 |
| Latin America | Colombia | 324 | 223 | 150 | 58 |
| Latin America | Mexico | 267 | 208 | 98 | 41 |
| Southeast Asia | Philippines | 344 | 284 | 152 | 59 |
| Southeast Asia | Singapore | 322 | 288 | 127 | 27 |
| Southeast Asia | Thailand | 288 | 228 | 106 | 49 |
| South Asia | India | 328 | 266 | 172 | 48 |
| Africa | Nigeria | 296 | 277 | 240 | 27 |
| Africa | South Africa | 324 | 251 | 176 | 69 |
This breakdown is useful for interpreting results because it separates (1) overall sample size per market from (2) the subset that is currently/previously crypto-active and (3) stablecoin holders specifically.
It also clarifies that the intent is measured as intention to acquire stablecoins, not necessarily immediate purchase behavior.
Adoption Level: Ownership Is Already High, And Intent Is Higher
Across the full sample:
- 54% held stablecoins in the last 12 months
- 56% intend to acquire more in the next 12 months
- 13% do not currently hold stablecoins but intend to acquire
The combination of high ownership and high intent suggests the market is not just expanding through new entrants, it’s also deepening through existing users planning to add more.
That depth signal is important for forecasting stablecoin transaction growth, because repeat users typically drive disproportionate volume.
Regional ownership and intent signal where “default usage” may emerge first
Current/recent stablecoin ownership (by region in this sample):
- Africa: 79%
- South Asia: 65%
- Asia Pacific: 62%
- Latin America: 54%
- North America: 52%
- Southeast Asia: 48%
- Europe: 36%
Intent to acquire stablecoins (by region):
- Africa: 76%
- South Asia: 65%
- Asia Pacific: 61%
- North America: 55%
- Latin America: 53%
- Southeast Asia: 51%
- Europe: 40%
These splits imply that adoption is being pulled by different jobs to be done depending on region.
In some markets, stablecoins are closer to day-to-day financial resilience and cross-border functionality, while in others they appear more adjacent to investment or platform-based utility.
Ownership and intent by country (behavioral heatmap, simplified)
| Country | Current/recent ownership | Intent to acquire |
|---|---|---|
| United Kingdom | 32% | 40% |
| France | 40% | 39% |
| Germany | 38% | 40% |
| United States | 52% | 55% |
| Australia | 62% | 61% |
| Brazil | 47% | 50% |
| Argentina | 56% | 56% |
| Colombia | 67% | 55% |
| Mexico | 47% | 49% |
| Philippines | 54% | 57% |
| Singapore | 44% | 49% |
| Thailand | 46% | 47% |
| India | 65% | 65% |
| Nigeria | 87% | 80% |
| South Africa | 70% | 72% |
Interpretation: In this dataset, the strongest ownership + forward intent combination appears in Nigeria, South Africa, India, and Australia, while Europe shows a materially lower baseline.
From a product standpoint, that typically means Europe is more sensitive to distribution, compliance clarity, and mainstream UX, whereas higher-adoption markets may respond faster to improved acceptance and rails.
Holdings Are Growing: This Is Not Static Ownership
Respondents report strong year-over-year momentum:
- 49% increased holdings (all markets)
- 30% remained the same
- 7% decreased
- The increased share rises to 54% in low/middle-income economies (vs 40% in high-income economies)
This matters because it signals repeat-buy behavior, not just one-time experimentation.
It also suggests stablecoins are being used in ongoing financial routines, like recurring earnings, recurring conversions, or regular storage of value, rather than episodic use.
Stablecoins Are Being Used As Wealth Allocation, Not A Side-Balance
Respondents allocate around one-third of savings to crypto/stablecoins:
- 34% overall mean
- 36% in low/middle-income economies
- 29% in high-income economies
This is a portfolio signal: stablecoins are being treated as an accessible digital dollar reserve layer inside a broader crypto allocation.
For product teams, it implies features like transparency of balances, reliable conversion, and low-friction movement across rails are central, not trader tools alone.
Who Owns Stablecoins In This Sample
Demographic and livelihood signals point to a user profile that is:
- Young: majority of owners/prospective acquirers are 18–34
- Entrepreneurial / income-flexible: higher propensity among those earning through business, entrepreneurship, or active trading
- Gender skew varies by region: men are more likely to own stablecoins overall (60%), but Africa shows near parity (51% women / 49% men in the cited breakdown)
A notable macro-attitude driver appears in low/middle-income economies: 85% say their country’s economic situation influences their use of crypto/stablecoins, rising to 92% in Africa.
That kind of response typically indicates stablecoins are being adopted as a pragmatic tool to navigate local financial constraints, not as a purely speculative bet.
Where Stablecoins Live: Exchanges Lead, But Distribution Is Still In Play
Preferred platform for managing stablecoins
- Exchange platforms: 46%
- Payment apps with crypto features: 40% (higher in low/middle-income economies)
- Mobile crypto wallet apps: 39%
- Bank/fintech apps: 23% (higher in high-income economies at 28%)
- Hardware wallets: 13%
What this implies: Consumer behavior is still routed through crypto-native platforms, but the bank/fintech channel is not blocked by lack of interest, it’s blocked by product availability and trust-building.
In practice, exchange-led management can persist even when users prefer mainstream UX, simply because the mainstream option is not yet available.
Bank/fintech wallet demand is strong
If a personal bank or fintech offered a stablecoin wallet:
- 77% are net likely (all markets)
- 83% net likely in low/middle-income economies
- 67% net likely in high-income economies (with a larger unsure segment)
That unsure wedge in high-income markets is important: it signals a buyer-education and UX problem, not lack of demand.
It also suggests that well-designed onboarding, clear risk disclosures, and familiar consumer protections could convert uncertainty into adoption.
Stablecoins Move Fast: Velocity And Conversion Behavior
Among stablecoin holders, the report highlights:
- 45% convert to local currency
- 27% spend directly on goods/services
- Only ~10% say they don’t intend to spend at all
- 28% convert/spend immediately or within days
This combination, conversion plus direct spending, indicates stablecoins are frequently acting as a transit asset between income and local financial needs.
It also reinforces that stablecoin utility is tightly linked to conversion options, settlement speed, and availability at the moment the user needs to pay.
Speed differs sharply by region (convert/spend within days)
- South Asia: 45%
- Latin America: 32%
- Africa: 28%
- Asia Pacific: 27%
- Southeast Asia: 26%
- North America: 19%
- Europe: 17%
Interpretation: In several regions, stablecoins behave less like a stored asset and more like a high-frequency financial instrument, a bridge between earning, converting, and consumption.
Where velocity is highest, product reliability and predictable fees tend to matter more than advanced feature depth.
Spending: What People Do Today Vs What They Want To Do
A consistent pattern shows up: desire to spend exceeds actual spending across all tested categories. This is one of the most operationally actionable insights in the dataset because it points directly at where product and distribution improvements can unlock usage.
One of the clearest gaps:
Major/lifestyle purchases:
28% currently spend vs 42% want to
And everyday + subscriptions are the most frequently cited desired spending cluster globally (with strong showings in high-adoption markets). This supports the idea that the next wave is less about niche merchant categories and more about normal, recurring spend.
Category demand varies by country: a practical signal for go-to-market
In the desire to spend by category matrix, Nigeria is consistently highest across use cases. Examples (desire metrics shown in the table):
- Day-to-day online purchases: 52%
- Subscriptions: 40%
- Big purchase: 49%
Other markets (e.g., South Africa, India, Philippines) also show elevated appetite in everyday and subscription spend categories, supporting the report’s claim that users want mainstream payment behavior, not niche experimentation.
From a merchant strategy perspective, this suggests that integrating stablecoin acceptance into standard checkout stacks (not bespoke crypto checkouts) is likely the highest-ROI path.
Stablecoin Cards: A Bridge Product With High Stated Adoption
Nearly 71% would use a linked debit card to spend stablecoins:
- 78% in low/middle-income economies
- Africa is the highest-likelihood region (reported at ~89%)
Why this matters: Cards abstract away blockchain choice, wallet complexity, and merchant integration constraints, turning stablecoins into a familiar spending primitive.
They also map stablecoins onto the rails consumers already understand (authorization, receipts, disputes), which is directly aligned with the “make it feel normal” demand signal.
Why People Pay With Stablecoins: Practicality Beats Ideology
Top cited motivators:
- Lower fees (30%)
- Security (28%)
- Ability to use internationally (27%)
- Merchant acceptance (26%)
- Faster settlement (25%)
- Easier currency conversion (25%)
The pattern differs by economic context:
- In low/middle-income economies, cross-border access rises as a driver.
- In high-income economies, fee efficiency and trust in the technology weigh more.
This is a useful corrective for messaging: the strongest reasons are not philosophical. They’re about cost, reliability, and reach, meaning adoption can be accelerated by improving measurable user outcomes (fees, speed, acceptance) rather than trying to sell the concept.
The Cost Argument: Stablecoins Compress Cross-Border Fees Materially
The report references World Bank data that the average cost to send $200 internationally is 6.4%, with some corridors (notably to Sub-Saharan Africa) exceeding 8%.
In the survey’s findings, those receiving payments or remittances in crypto/stablecoins report ~40% average fee savings vs traditional methods, with:
- 35% savings in high-income economies
- 41% savings in low/middle-income economies
- South Asia highest impact at 45%
Interpretation: This is one of the strongest utility proofs in the dataset (savings are not marginal), they’re economically meaningful.
For many users, reducing fees and delays can be the difference between a viable cross-border income stream and one that’s too costly to sustain.
What People Dislike: The Friction Is Product Design (And Acceptance), Not The Rails
Top frustrations cited:
- Irreversible payments / risk of losing funds (30%)
- Too many steps (22%)
- Needing to select a specific blockchain or stablecoin (20%)
- Exchange rate not favorable / higher than expected (20%)
- Confusing language at checkout (19%)
- Manual wallet address entry (19%)
These are the kinds of problems consumers interpret as: This doesn’t work like normal payments.
The common thread is not that stablecoins are unusable, it’s that the current experience often requires specialist knowledge and imposes irreversible consequences for small mistakes.
What users are actually asking for
Across the improvement requests:
- Universal merchant acceptance
- Speed + reliability
- Built-in consumer protections (refunds, recovery)
- Simpler UX
- Predictable fees and clear conversion visibility
A tight way to frame it (consistent with Chris Harmse’s commentary) is: the infrastructure is increasingly viable; the missing layer is acceptance + integration + protection that makes stablecoin payments feel default.
In product terms, this is connective tissue: integration into normal checkout, clearer pricing, and safety nets that reduce fear of loss.
USDT Vs USDC: Ownership Skews By Market
The country split between USDT and USDC is not uniform:
- Nigeria: USDT 89% vs USDC 48%
- Australia: 34% vs 29%
- India: 30% vs 27%
- United States: 22% vs 25% (USDC slightly higher)
- South Africa: 23% vs 29% (USDC higher)
- Germany: 15% vs 17% (USDC higher)
- France: 21% vs 14%
- Brazil: 14% vs 16% (USDC higher)
Interpretation: Product teams should avoid assuming a single default stablecoin. Preferences and holdings vary materially by geography, which impacts liquidity routing, wallet defaults, and merchant settlement options.
It also affects what acceptable fees and conversion paths look like, since different coins may dominate different rails and platforms in each market.
Getting Paid In Stablecoins: Where Usage Becomes Structural
Among those getting paid in stablecoins (freelancers, gig workers, marketplace sellers):
- Stablecoins represent ~35% of annual earnings (mean)
And for cross-border work:
- 73% of freelancers/gig workers say crypto/stablecoins improved their ability to work with international clients (with 46% saying the improvement was significant)
- 76% of marketplace sellers/hosts report improved sales volume or customer base (with 41% significant)
- Interest in accepting crypto/stablecoins from international customers is 77% overall (44% very interested)
Interpretation: This is the clearest stablecoins as income infrastructure signal.
When stablecoins are tied to payroll or sales, they stop being optional, they become operational. That also explains why reliability, predictable fees, and easy cash-out/spend options matter so much: users are routing real livelihood flows, not side experiments.
Strategic Implications For 2026: What This Data Suggests Builders Should Prioritize
1. Merchant acceptance is the bottleneck:
Demand to spend exceeds current spending in every category. If acceptance expands, usage follows, especially in everyday and subscription categories where demand is already broad.
2. UX normalization is the growth lever:
People want stablecoins to behave like existing payment methods: fewer steps, fewer choices, clearer pricing, and recovery paths. The faster products remove expert-only requirements, the faster adoption can broaden.
3. Cards (and card-like abstractions) are a near-term bridge:
High stated likelihood indicates consumers want familiar spending interfaces. Cards also let merchants accept stablecoin-funded spending without rebuilding checkout from scratch.
4. Banks/fintech can capture distribution, if they ship:
77% would open a wallet in a bank/fintech app; the limiting factor is not consumer interest. The winners are likely those that combine trust, compliance clarity, and seamless UX.
5. Go-to-market should be region-specific:
Ownership, velocity, and coin preference vary widely across markets; a single global playbook will underperform. Product defaults, supported rails, and messaging should be tuned to local realities.
Conclusion
This dataset shows stablecoins as a high-momentum consumer tool: ownership is widespread in multiple regions, holdings are growing, and stablecoins are used quickly after acquisition.
The adoption ceiling is not primarily a blockchain problem. It’s an acceptance, UX, and consumer-protection problem, solvable with better integration and distribution.
If 2026 is the year stablecoins become normal payments, this report points to the path: expand merchant acceptance, simplify the user journey, and deliver stablecoin spending through interfaces people already trust.
The strongest opportunities sit where user desire is already proven and friction is the only thing holding behavior back.
Read Next:
- The U.S. Stablecoin Regulatory Reset
- 50 Stablecoin Statistics That Matter in 2026
- Tokenized Money Market Funds: Everything you Need to Know for 2026
FAQs:
1. What Does This Survey Measure In Practice?
It measures how crypto-active consumers across 15 countries use stablecoins today, how fast they convert or spend them, and what they want improved, based on online fieldwork from September to October 2025.
2. How Many People Own Stablecoins In The Sample?
54% report holding stablecoins in the last 12 months, showing stablecoins are already a common tool among this crypto-engaged audience.
3. How Strong Is Future Demand For Stablecoins?
56% intend to acquire more stablecoins in the next 12 months, and 13% of non-holders intend to start, indicating continued expansion beyond current owners.
4. Which Regions Show The Highest Ownership And Intent?
Africa leads on both ownership and forward intent in this dataset, with South Asia also showing consistently high ownership and acquisition intent.
5. Are Stablecoins Mostly Held Or Actually Used?
They are actively used. 28% convert or spend within days, and only a small minority say they do not intend to spend at all.
6. What Is The Biggest Reason Stablecoin Spending Lags Demand?
Merchant acceptance and checkout usability. Users want stablecoins to work like mainstream payments, with fewer steps, clearer fees, and consumer protections.
7. What Do People Want To Spend Stablecoins On Most?
Everyday purchases and subscriptions are the most common desired spending categories, and major purchases show one of the largest gaps between desire and current usage.
8. Which Platforms Do Users Prefer For Managing Stablecoins?
Exchange platforms lead at 46%, but there is strong stated demand for managing stablecoins inside bank or fintech apps if offered.
9. Do Stablecoins Reduce Cross-Border Payment Costs?
Yes. The data indicates meaningful fee savings for users receiving payments or remittances in crypto and stablecoins compared with traditional methods, with the largest impact reported in some regions.
10. What Should Product Teams Prioritize Based On These Results?
Increase merchant acceptance, simplify user flows, make fees predictable, add consumer protections, and distribute through trusted interfaces like banks, fintech apps, and card-based spending.
Disclaimer:
This content is provided for informational and educational purposes only and does not constitute financial, investment, legal, or tax advice; no material herein should be interpreted as a recommendation, endorsement, or solicitation to buy or sell any financial instrument, and readers should conduct their own independent research or consult a qualified professional.
