
Table of Contents
As Bitcoin grapples with volatility in early November 2025, key on-chain indicators are pointing toward a potential market bottom.
The Stablecoin Supply Ratio (SSR), a crucial metric gauging sidelined capital in stablecoins relative to Bitcoin's valuation, has plummeted to historic lows around 13-14.
With Bitcoin recovering to approximately $103,649 after dipping below $101,000 amid market fears, this SSR decline suggests a buildup of buying power that could ignite a rebound, mirroring patterns seen earlier in the 2025 bull cycle.
Analysts from CryptoQuant and prominent voices on X, such as Crypto Rover, emphasize that these levels have previously heralded 20-50% price surges, fueled by shifting liquidity from stablecoins back into risk assets like BTC.
Key Takeaways
- SSR at Cycle Lows: The ratio has dipped to 13-14, reflecting substantial stablecoin liquidity relative to Bitcoin's market cap of over $2 trillion, a configuration that has sparked rebounds throughout 2025.
- Historical Parallels: Comparable SSR drops in April and July 2025 preceded rallies of 25-40%, positioning SSR as a reliable proxy for "dry powder" poised to re-enter the crypto market.
- Supporting On-Chain Signals: Indicators like Adjusted Spent Output Profit Ratio (aSOPR) hovering near 1.0 and 30-33% of Bitcoin supply in loss highlight seller exhaustion and undervaluation.
- Risks Ahead: Despite the bullish setup, macroeconomic pressures such as potential Federal Reserve rate decisions or ETF outflows could drive prices lower to $95,000 if catalysts fail to materialize.
- Market Context: Total stablecoin supply has expanded to around $160-310 billion in 2025, led by Tether (USDT) at $183 billion and USDC at $75 billion, amplifying the SSR's significance in signaling liquidity shifts.
What Is the Stablecoin Supply Ratio (SSR) and Why Does It Matter for Bitcoin?
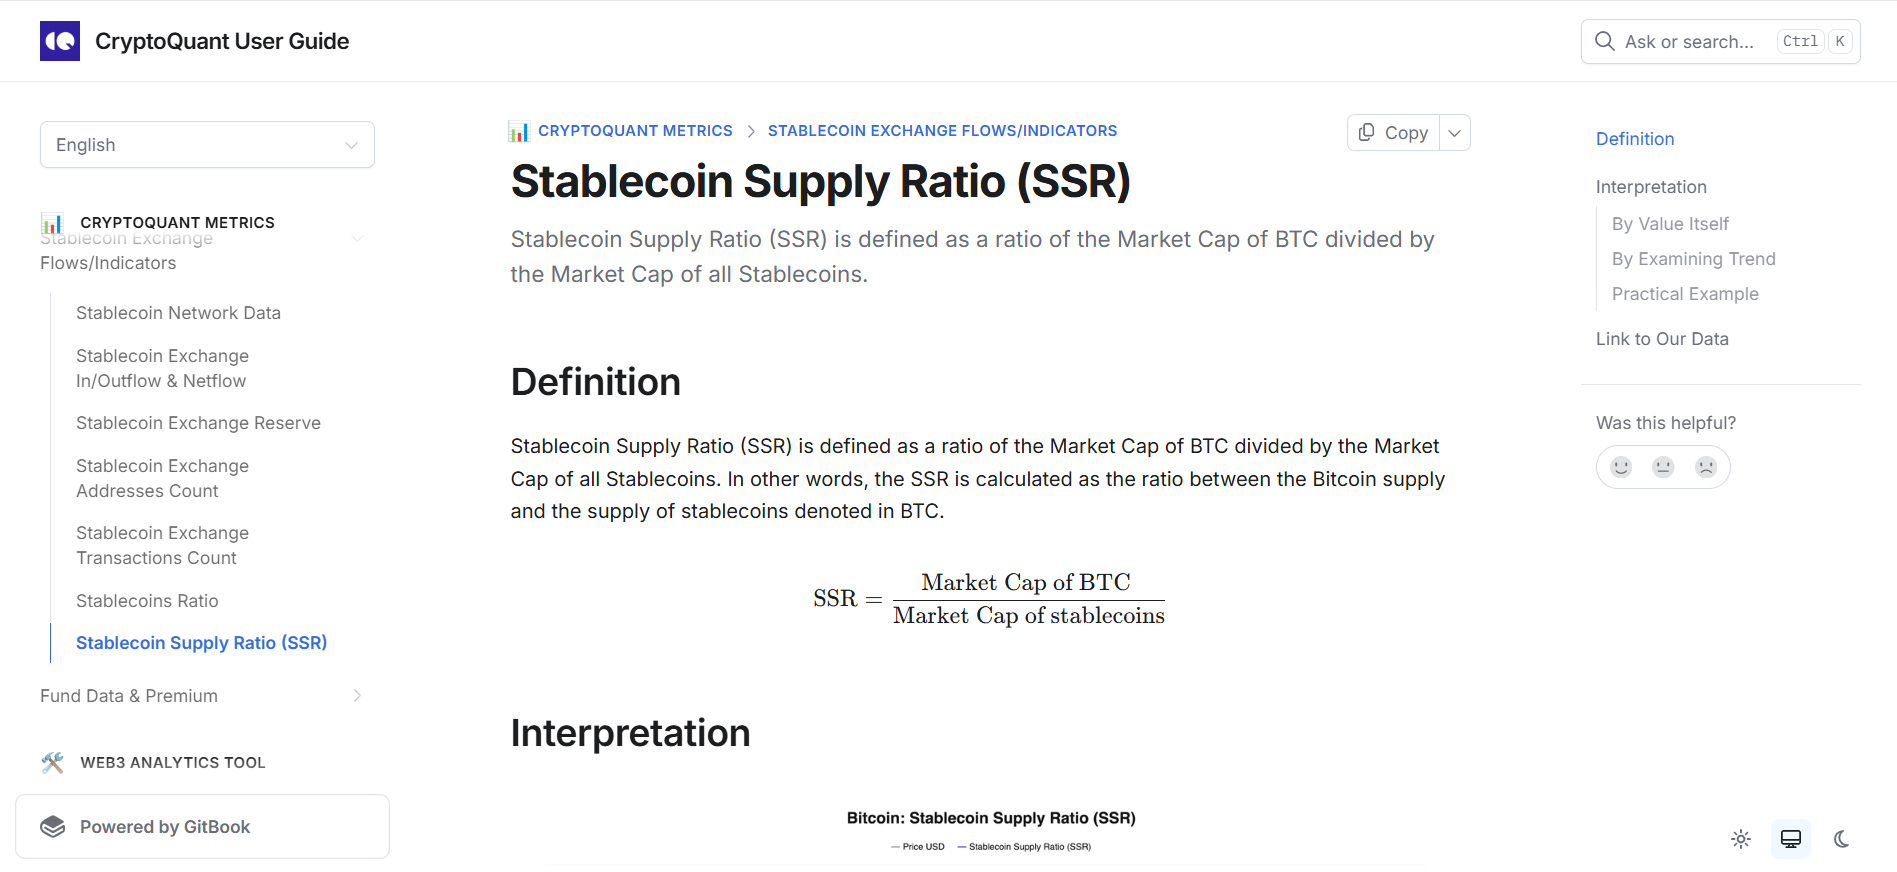
The Stablecoin Supply Ratio (SSR) is an on-chain metric calculated by dividing Bitcoin's market capitalization by the total market capitalization of major stablecoins, including USDT, USDC, DAI, and others.
This ratio serves as a barometer for potential buying power in the crypto ecosystem.
When SSR falls to low levels, it indicates that stablecoin supplies have grown disproportionately to Bitcoin's value, often during price corrections, creating a reservoir of capital that can flow back into BTC and drive recoveries.
Historically, SSR has proven reliable in spotting market bottoms. For instance, in past bull cycles like 2021, SSR dips below 15 correlated with significant rebounds as investors deployed stablecoin holdings. In the current 2025 cycle, similar lows have marked turning points, with data from CryptoQuant charts showing SSR entering "bottom zones" around 13, often followed by price upswings.
Visualizations from analysts like Crypto Rover illustrate this trend, where SSR's decline aligns with Bitcoin's price stabilizing after sell-offs, underscoring its role as a liquidity turning point.
Current SSR Levels: Analyzing the November 2025 Dip
As of November 9, 2025, the SSR has fallen to approximately 13-14, amid Bitcoin's recent correction where it briefly fell under $101,000 before rebounding to $103,649.
This level mirrors readings from April 2025 (around 13.8) and July 2025 (near 14.5), both of which preceded substantial rallies of 25-40% as capital rotated from stablecoins.
Key drivers include the explosive growth in stablecoin supplies, now totaling $310 billion across all listed assets, with Tether (USDT) dominating at $183 billion and Circle's USDC at $75 billion. Bitcoin's market cap stands at $2.066 trillion, creating the low SSR ratio.
Recent X discussions, including posts from Crypto Rover and On-Chain Mind, describe this as a "bullish beacon" and "lowest level since COVID," highlighting liquidity poised for deployment.
Supporting On-Chain Metrics Reinforcing the Bottom Signal
Complementing the SSR signal, several on-chain metrics suggest Bitcoin is approaching capitulation and undervaluation:
Additional factors, such as ETF outflows and extreme fear sentiment (Fear & Greed Index at historic lows), further support a potential pivot, though exchange inflows remain a watchpoint.
Potential Implications, Catalysts, and Risks for Bitcoin's Next Move
In a bullish scenario, renewed stablecoin inflows could propel Bitcoin toward new highs, potentially surpassing its October 2025 all-time high of $126,080, especially if Federal Reserve rate cuts (with 67% odds for December) materialize. This liquidity shift might also boost altcoin dominance and Ethereum-related trends like staking.
However, risks loom: Slowing stablecoin issuance, persistent macro uncertainties, or further leverage unwinds could extend the correction to $95,000 support levels.
Broader crypto liquidity, including rising exchange stablecoin reserves to $73 billion, could mitigate this if inflows accelerate.

Conclusion
The Stablecoin Supply Ratio's plunge to historic lows in November 2025 paints a compelling picture of Bitcoin nearing a cycle bottom, akin to earlier recoveries in this bull market.
Backed by corroborating on-chain data, this signal highlights stablecoins' growing influence in crypto dynamics. Yet, confirmation hinges on positive triggers like ETF inflows and favorable macro conditions.
Investors eyeing Bitcoin's rebound should stay vigilant, as this could mark the prelude to the bull cycle's final push.
Read Next:
- 12 Top Stablecoin Aggregators to Use in 2025
- Are Algorithmic Stablecoins Still Being Used in 2025?
- The 2025 STABLE Act: Complete Breakdown of America's New Stablecoin Regulation
FAQs:
1. What is the Stablecoin Supply Ratio (SSR) and how does it signal a Bitcoin market bottom?
SSR is Bitcoin's market cap divided by major stablecoins' market cap; lows like 13-14 signal high buying power, as seen in 2025 rebounds when capital flows from stablecoins to BTC.
2. Is Bitcoin at a bottom in November 2025 based on SSR levels?
With SSR at 13-14 alongside metrics like aSOPR ~1.0 and supply in loss at 30-33%, evidence suggests yes, echoing April/July recoveries, though macro confirmation is key.
3. How has SSR performed in past Bitcoin bull cycles?
SSR dips below 15 have historically triggered 20-50% rallies, serving as a liquidity indicator for sidelined stablecoin capital entering the market.
4. What risks could invalidate the Bitcoin bottom signal from SSR?
Factors like delayed rate cuts, continued ETF outflows, or decelerating stablecoin growth might push prices to $95,000, overriding the bullish on-chain setup.
5. How does stablecoin supply growth impact Bitcoin's price in 2025?
Expansion to $310 billion+ outpacing Bitcoin during dips lowers SSR, indicating potential capital inflows and sustaining bull market momentum.


