

Table of Contents
Stablecoins are simple on the surface and complex in practice. A token can trade close to $1 while liquidity is thinning, redemptions are slowing, or chain-level constraints are building.
If you hold stablecoins as working capital, use them for payments, or keep them in DeFi, you need a monitoring system that answers one question consistently:
If conditions deteriorate, will I know early enough, and can I exit at acceptable cost?
A personal stablecoin risk dashboard is not a “prediction engine.” It is an evidence system: a small set of decision-grade metrics, refreshed on a schedule, backed by stored raw data, with alert rules you can explain.
Key Takeaways
- A stablecoin risk dashboard must measure peg deviation, persistence, liquidity-at-size, supply shifts, and control-surface risk in one system.
- Off-peg bps and depeg duration are the fastest indicators of sustained market stress.
- Slippage-at-size is the most practical liquidity metric because it measures real exit cost.
- Supply change and chain distribution reveal structural dependency and migration risk over time.
- Reserve observability and disclosure freshness should be tracked explicitly to avoid false confidence.

What “Stablecoin Risk” Means in Practice
A stablecoin dashboard should track failure modes, not narratives. In 2025, the most useful stablecoin risk taxonomy for a personal dashboard looks like this:
1) Peg Risk
Definition: The probability and severity of meaningful deviation from the target price (usually $1).
What you can observe:
- Market price deviation and persistence
- Price dispersion across venues (DEX vs CEX)
- Volatility around the peg during stress windows
What you cannot prove from price alone:
- Whether the issuer can redeem at scale
- Whether reserves are liquid enough under stress
2) Liquidity Risk
Definition: Your ability to convert stablecoins to your desired asset (USD, bank balance, other stablecoins) with acceptable slippage and speed.
What you can observe:
- DEX pool depth proxies and concentration
- Slippage at standard order sizes
- Route diversity (how many independent pools/venues provide liquidity)
3) Reserve / Collateral Risk
Definition: The probability that backing (or stabilization mechanisms) fail to support redemptions and peg maintenance.
What you can observe reliably:
- Disclosure cadence (freshness)
- On-chain proof-of-reserve style signals (only where implemented)
- Structural indicators (supply expansion/contraction patterns)
What remains partially off-chain:
- Custodial arrangements
- Legal claim structure and redemption policy details
4) Market Structure Risk
Definition: Concentration and dependency risks created by holder distribution, chain distribution, venue distribution, and bridge exposure.
What you can observe:
- Supply distribution across chains
- Top holder concentration (where address labeling allows)
- Bridged vs native representations
5) Technical and Control Risk
Definition: Risks introduced by contract design, admin privileges, upgrades, freezes/pauses, or dependencies (cross-chain bridges, oracles, chain liveness).
What you can observe:
- Contract features and roles (pause/freeze patterns where visible)
- Upgradeability patterns (proxy usage)
- Chain health proxies (block time anomalies, halted periods)
Principles for a Dashboard That “Actually Works”
If you follow only five principles, your dashboard will be useful:
- Keep the metric set small and explicit: If you cannot write a one-line definition for a metric, it does not belong on the main page.
- Measure persistence, not blips: Alerts should trigger on sustained conditions (time-over-threshold), not one-minute spikes.
- Store raw inputs: Every chart and alert should be reproducible from stored data.
- Track data freshness as a first-class metric: Stale inputs create false confidence.
- Separate “market” from “mechanism”: Price is the market signal; liquidity, supply/flows, and controls explain mechanism stress.

The Open-Source Stack
You can build this in two layers: Minimal Viable and Production-Grade.
1. Minimal Viable Stack (Recommended Starting Point)
This gets you decision-grade monitoring quickly.
Ingestion
- Python scripts on a scheduler (cron or a lightweight orchestrator)
- Pull market/supply snapshots from your chosen sources
- Optional: pull pool state and swap data from chain RPCs
Storage
- PostgreSQL (or SQLite if you insist on ultra-simple)
Visualization and Alerts
- Grafana for dashboards and alerting
- Optional: Prometheus for time-series storage and alert rules (especially if you want metrics-style alerting)
This setup supports:
- Peg deviation monitoring
- Supply and chain distribution trends
- Basic liquidity proxies
- Actionable alerts with persistence thresholds
2. Production-Grade Stack (If You Want Reliability and Auditable Pipelines)
Use this when you care about uptime and reproducibility.
- Ingestion / ELT: An ELT tool for API pulls (optional, but helpful if you scale sources)
- Orchestration: A workflow orchestrator to manage retries, scheduling, and failures
- Transforms and Tests: dbt Core for transformation logic and tests (null checks, bounds, freshness)
- Analytics: DuckDB for fast local analysis and backtesting
- Dashboards:
- Grafana for operations-style dashboards
- Superset or Metabase for BI-style exploration (optional)
The point is not tool purity. The point is repeatability: you want the same inputs to produce the same outputs tomorrow.
The Metrics That Matter (And How to Compute Them)
A personal dashboard works best with 12–16 metrics grouped into five categories. Below is a practical set you can implement and audit.
A) Peg and Price Integrity Metrics
1. Off-Peg (Basis Points)
- Definition:
off_peg_bps = abs(price - 1.00) * 10,000 - Why it matters: A universal, interpretable measure across stablecoins.
Useful panels
- Off-peg bps (last 24h)
- Rolling max off-peg (1h / 24h / 7d)
- Rolling median off-peg (to avoid one-tick noise)
2. Depeg Duration
- Definition: total minutes/hours in a window where
off_peg_bpsexceeds a threshold. - Example thresholds: 25 bps (0.25%), 50 bps (0.50%), 100 bps (1.00%)
This metric is what separates:
- “A short volatility event” from
- “A sustained market confidence problem”
3. Depeg Frequency
- Definition: number of threshold breaches per day/week.
- Why it matters: Repeated threshold crossings often precede a more persistent break.
4. Venue Divergence (Optional but Valuable)
- Definition: difference between DEX-based price proxy and a centralized venue proxy (or an index).
- Why it matters: Divergence can indicate fragmented liquidity or localized stress.
If you cannot get reliable multi-venue data, skip this metric rather than forcing it.
B) Liquidity and Exit-Ability Metrics
Liquidity is where “safe on paper” becomes “painful in practice.”
1. Liquidity Depth Proxy
At a minimum, track:
- Top pools by TVL or reserve depth
- Concentration: share of liquidity in top 3 pools
- Chain split: where liquidity is concentrated
Liquidity concentration metric
top3_pool_share = (TVL_top1 + TVL_top2 + TVL_top3) / TVL_total
High concentration means one pool disruption can materially affect exit costs.
2. Slippage-at-Size (Most Useful Liquidity Metric)
Pick two sizes that match your reality:
- “Personal exit” size (e.g., $10k)
- “Large exit” size (e.g., $100k)
Compute simulated price impact on:
- The best route (lowest slippage)
- The worst major route (stress proxy)
Store the result as time series:
slippage_10k_bpsslippage_100k_bps
If you do only one liquidity metric, do this one.
3. Liquidity Shock Indicator
- Definition: day-over-day change in liquidity depth or TVL for key pools.
- Example trigger: “Top-pool TVL down > 25% in 24h”
C) Supply and Flow Metrics
Supply is a structural indicator. It does not tell you everything, but it tells you what the system is doing at scale.
1. Supply Level and Rate of Change
Track:
- Total circulating supply
- 1-day change
- 7-day change
- 30-day change
Core computation
supply_change_pct_7d = (supply_now - supply_7d_ago) / supply_7d_ago
Sharp contractions can align with redemption pressure; sharp expansions can align with aggressive issuance or demand spikes. Either may justify closer monitoring.
2. Chain Distribution
Track percentage of supply across chains:
share_chain_i = supply_chain_i / total_supply
Why it matters
- Operational dependencies: network congestion, fees, censorship risk
- Venue dependencies: certain stablecoins have dominant rails
3. Bridged vs Native Supply (Where Applicable)
If a stablecoin exists as:
- Native on a chain, and
- Bridged or wrapped versions elsewhere,
Track the bridged share explicitly. Bridge exposure is a distinct risk category and should not be hidden inside “chain distribution.”
D) Backing and Reserve Observability Metrics
These metrics must be honest about what you can and cannot verify.
1. Disclosure / Attestation Freshness
- Definition: days since latest issuer disclosure or attestation
- Panel: “Last updated: X days ago”
- Alert concept: “Freshness exceeds expected cadence”
This is not a judgment of quality. It is a measurable uncertainty signal.
2. Reserve Observability Flag
A binary or categorical field you maintain:
- “On-chain reserve feed available”
- “Issuer attestation available”
- “No reliable reserve data in dashboard inputs”
This prevents your dashboard from implying certainty.
3. Proof-of-Reserve Status (Only If You Truly Have It)
Where you can ingest a reserve feed:
- Track last update timestamp (staleness)
- Track value vs threshold (if the feed supports it)
If you do not have this reliably, omit it. Do not “fake” reserve confidence.
E) Technical and Control-Surface Metrics
1. Contract Privileges Inventory
Maintain a small inventory per token:
- Pause functionality present (yes/no)
- Freeze/blacklist present (yes/no)
- Upgradeable proxy pattern present (yes/no)
- Admin role addresses (if you track them)
This is a static panel, but it materially changes how you interpret events.
2. Mint/Burn Anomaly Detector
- Track daily mint and burn totals
- Alert on outliers relative to recent history
A simple approach:
- Compute rolling mean and standard deviation
- Alert when today exceeds mean by a chosen multiple
3. Chain Health Proxy (Optional)
If you rely heavily on a specific chain:
- Track block times, failed RPC calls, or halted periods
- Alert when your data pipeline detects chain instability
A Data Dictionary Table You Can Implement
Below is a practical data dictionary format. Put it in your repo and keep it updated.
| Metric | Definition | Refresh | Main Use | Alert Style |
|---|---|---|---|---|
| off_peg_bps | abs(price-1)*10,000 | 1–5 min | Peg stress | threshold + persistence |
| depeg_minutes_50bps | minutes off_peg_bps>50 | 5–15 min | Peg persistence | daily sum + spike |
| slippage_10k_bps | simulated impact for $10k | 5–15 min | Exit cost | threshold + jump |
| supply_change_pct_7d | (now-7d)/7d | 1–24h | Structural stress | anomaly bands |
| top3_pool_share | top3 TVL / total TVL | 1–24h | Concentration | threshold |
| attestation_age_days | days since update | 1–7d | Observability | stale warning |
This table becomes your truth. It stops the dashboard from turning into opinion.
Storage Schema: A Simple Postgres Model
A workable schema looks like:
Prices
timestampstablecoinsourceprice
Supply
timestampstablecointotal_supply
Supply_by_chain
timestampstablecoinchainsupply
Dex_pools
timestampstablecoinchainpool_addresspool_tvlreserve_areserve_b
Slippage_estimates
timestampstablecoinchainsize_usdslippage_bpsroute_id
Controls_inventory
stablecoinchaincontract_addresspausablefreezableupgradeable_proxylast_checked
Disclosures
stablecoinreport_dateobservability_levelnotes
Even if you start minimal, you should store:
- timestamps
- sources
- and raw values
Dashboard Layout: What to Put on Screen
Page 1: Overview (60-Second Daily Check)
- Current off-peg bps + 24h rolling max
- Depeg minutes (50 bps threshold) for last 7 days
- Slippage-at-size (10k and 100k)
- Supply change (7d and 30d)
- Attestation freshness (age in days)
- A single “Risk Status” tile (Green/Amber/Red) based on rules
Page 2: Peg
- Off-peg bps time series (24h and 7d)
- Depeg frequency chart
- Venue divergence (if available)
Page 3: Liquidity
- Top pools TVL over time
- Slippage-at-size over time
- Liquidity concentration (top3 share)
Page 4: Structure and Controls
- Supply by chain (stacked)
- Bridged vs native share
- Controls inventory and last checked date
- Mint/burn anomalies
Alert Rules That Don’t Spam You
The best alert systems are conservative and persistent.
Peg Alerts (Examples)
- Actionable:
off_peg_bps > 50for 30 minutes - Escalation:
off_peg_bps > 100for 15 minutes - Contextual:
depeg_minutes_50bps > Xin the last 24h
Liquidity Alerts (Examples)
- Actionable:
slippage_10k_bpsincreases by > 2x vs 7-day median - Escalation:
slippage_100k_bps > 200for 30 minutes - Concentration:
top3_pool_share > 0.80
Structural Alerts (Examples)
- Actionable:
abs(supply_change_pct_7d) > threshold(you calibrate per stablecoin) - Escalation: mint/burn anomaly beyond your defined band
Data Quality Alerts (Do Not Skip These)
- “Price feed stale > 10 minutes”
- “Supply feed stale > 24 hours”
- “Pool snapshot missing for key pools”
- “Pipeline failures > N in last hour”
If your data is stale, your confidence should drop.
A Simple, Explainable Risk Score Model
A personal risk score is useful if it is:
- explainable
- stable
- and consistent
Example Inputs and Weights
- Peg stability: 35%
- Liquidity and slippage: 25%
- Supply/flow stability: 15%
- Concentration (liquidity + chain): 15%
- Observability (freshness/availability): 10%
Example Scoring Logic (Conceptual)
- Convert each category into a 0–100 subscore using thresholds and persistence.
- Combine via weighted average.
- Add “hard overrides”:
- If off-peg > 200 bps for 30 minutes, cap score at Amber/Red regardless of other metrics.
- If data freshness fails, cap confidence.
This score is not “truth.”
It is a compression tool so Page 1 stays readable.
Implementation Blueprint: Step-by-Step
Step 1: Define Scope
- Stablecoins: start with 2–4 you actually use
- Chains: the top rails you hold on
- Refresh cadence:
- price: 1–5 minutes
- DEX liquidity: 5–15 minutes
- supply/chain distribution: hourly or daily
- disclosures: daily or weekly
Step 2: Build the Data Model
- Create tables above
- Store sources and timestamps
- Normalize stablecoin identifiers
Step 3: Ingest Data
- Pull price and supply snapshots
- Pull pool reserves/TVL for key pools
- Optionally query holder concentration periodically
Step 4: Compute Metrics
- Compute off-peg bps, depeg minutes, rolling maxima
- Compute slippage-at-size
- Compute supply changes and chain shares
- Compute freshness metrics
Step 5: Visualize and Alert
- Build the four dashboard pages
- Add the alert rules with persistence
- Route alerts into a channel you will actually read
Step 6: Backtest and Calibrate
- Pick historical stress windows
- Verify that alerts trigger on meaningful events
- Reduce sensitivity until false positives drop materially
The goal is not to catch every 30-second wobble.
The goal is to catch conditions that change your decisions.
Common Mistakes That Make Dashboards Useless
- Using only price charts: Peg health without liquidity context is incomplete.
- Alerting on single ticks: You will mute alerts and miss real events.
- Ignoring slippage-at-size: Exit cost is the practical risk.
- Not storing raw inputs: If you cannot reproduce an alert, you cannot trust it.
- Pretending you can “verify reserves” from thin data: Track observability honestly.
Conclusion
A personal stablecoin risk dashboard is a discipline, not a one-time build.
- Start with a minimal metric set that answers real decisions: “Is the peg stable, can I exit at acceptable cost, and are structural indicators deteriorating?”
- Store raw data, track freshness, and make alerts persistent so you do not get spammed.
- Add complexity only when it improves decision quality.
If your dashboard can explain each alert in one sentence and reproduce it from stored inputs, it will work under stress, when you need it most.
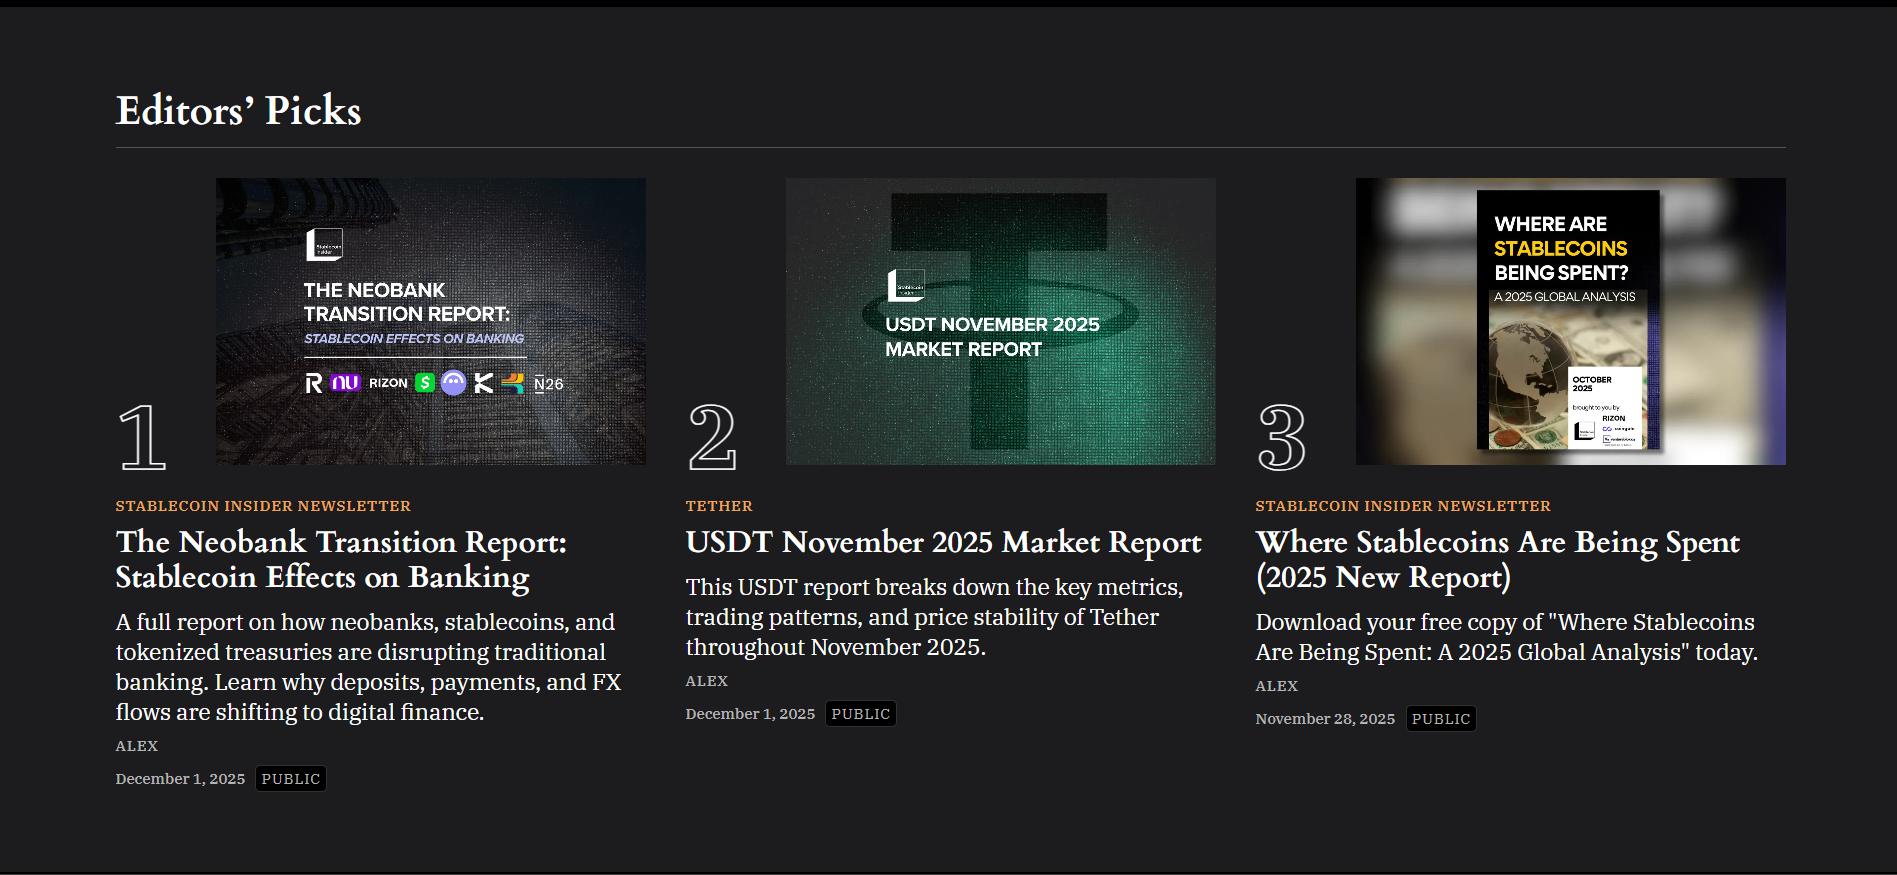
Read Next:
- The Neobank Transition Report
- USDT November 2025 Market Report
- Where Stablecoins Are Being Spent (2025 New Report)
FAQs:
1. What are the most important stablecoin risk metrics?
The most important metrics are off-peg bps, depeg duration, slippage-at-size, supply change, and chain distribution because they capture price stress and exit risk.
2. How often should a stablecoin dashboard refresh?
A useful baseline is price every 1–5 minutes, liquidity every 5–15 minutes, and supply/chain distribution daily because each category changes on different timescales.
3. What is the best way to measure liquidity risk for stablecoins?
The best way is slippage-at-size because it directly estimates how expensive it is to exit a position at your typical order sizes.
4. Can I build this entirely with open-source tools?
Yes, you can build it with open-source components by using a script-based ingestion pipeline, a local database, and Grafana for dashboards and alerts.
5. Does a dashboard prove a stablecoin is fully backed?
No, a dashboard does not prove full backing because reserves and legal redemption terms are partly off-chain, so you should track disclosure freshness and reserve observability instead.
6. What alert rule is most actionable for retail or operator monitoring?
An actionable rule is “off-peg bps above a threshold for a sustained period” because persistence filters noise and highlights conditions that can change exit outcomes.


