
Table of Contents
Stablecoins entered 2026 in a much stronger position than they held only a few years ago. They are no longer used mainly as crypto trading tools or as a place to park capital between volatile assets. The latest market data show that stablecoins are increasingly being used as payment infrastructure across consumer transfers, business payments, commercial flows, treasury activity, and regional settlement networks.
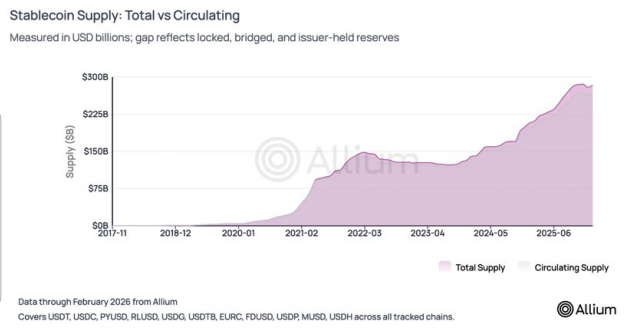
The biggest signal is not just that the market is bigger. It is that usage is growing faster than supply. Circulating supply reached approximately $266.3 billion by February 2026, while raw monthly onchain volume averaged about $5.6 trillion and adjusted monthly volume averaged about $985 billion.
At the same time, labeled payment volume reached $374.5 billion in 2025, payment transaction count climbed to 1.1 billion, and average payment ticket size fell to $342. Those patterns point to more frequent, more practical, and more embedded use.
This report also shows that the market is changing in structure. Stablecoin payments are becoming more domestic and intra-regional, not just cross-border.
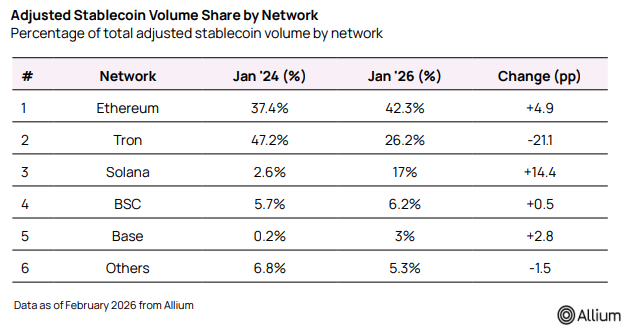
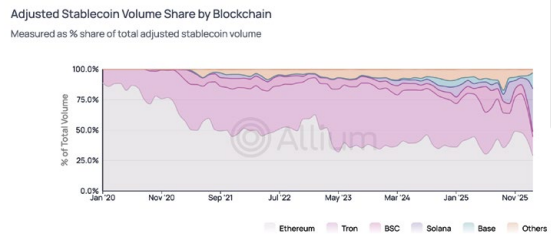
Ethereum and Tron still dominate supply, but Solana, BSC, and Base are capturing more transactional activity. Rather than converging on one blockchain, stablecoin infrastructure is becoming more specialized by role.
Key Takeaways
- Stablecoin circulating supply reached about $266.3 billion by February 2026, while labeled payment volume hit $374.5 billion in 2025.
- Adjusted transfer volume and payment transaction counts grew much faster than supply, showing stronger real-world usage.
- Stablecoin payment activity is becoming more domestic and intra-regional, not just cross-border.
- Ethereum and Tron still dominate supply, but Solana, BSC, and Base are gaining share in transactional activity.
- The market is evolving into a multi-chain infrastructure stack with different networks serving different functions.
Stablecoin Market Size And Growth In 2026
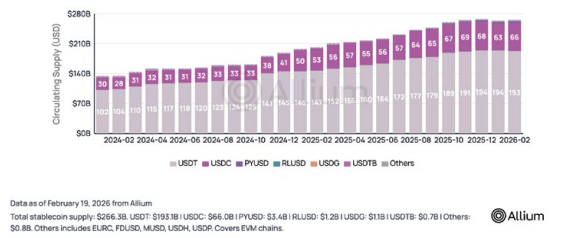
The stablecoin market reached a new scale in early 2026. Total circulating supply stood at roughly $266.3 billion as of February 2026. That level is important not only because it marks continued growth, but because the increase was sustained across 2025 rather than driven by a short-lived spike.
Supply expanded by 41% in 2025, with about $79 billion in new stablecoins added during the year. Quarterly growth averaged roughly 9.6% from late 2023 onward, which suggests a market that is compounding steadily rather than moving through isolated bursts of issuance. The mint-and-burn data reinforce this point.
Net issuance remained positive over a long period, with mints consistently outpacing burns.
This matters because supply growth is the foundation for everything else. A larger base of circulating stablecoins expands the amount of digital dollar liquidity available for payments, settlement, exchange activity, treasury management, and operational finance. But the more important question is what the market is doing with that larger supply. The answer, based on the rest of the data, is that stablecoins are being used more intensively.
Why Adjusted Stablecoin Volume Matters
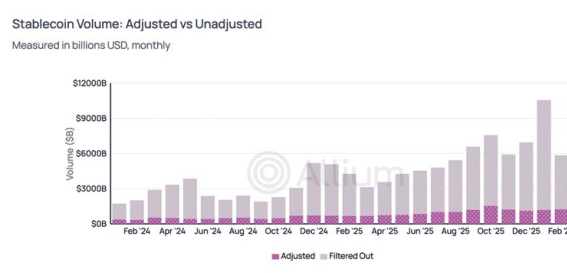
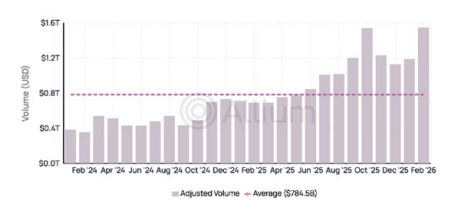
One of the most important analytical distinctions in the report is the difference between raw volume and adjusted volume. Raw onchain stablecoin volume averaged approximately $5.6 trillion per month in 2025. That headline number is large, but it overstates economically meaningful activity because blockchains also record internal exchange flows, wallet reshuffling, wash trading patterns, and round-trip transfers.
Adjusted volume removes those distortions. After filtering out entity-internal movements, wash trading, and single-direction round-trip activity, adjusted monthly volume averaged approximately $985 billion. In other words, only about 17.6% of raw monthly volume remained after the adjustment process.
That does not make the market look weaker. It makes it easier to interpret correctly. Raw volume captures everything that happened onchain. Adjusted volume is designed to isolate the activity that more closely resembles genuine economic usage. For anyone assessing stablecoins as payment rails, treasury tools, or financial infrastructure, adjusted volume is the more useful baseline.
The distinction also changes how the market should be discussed. Very large headline numbers can be impressive, but they can also hide what is actually happening underneath. Adjusted data show that stablecoin activity is still enormous, even after the noise is removed, and that growth remained strong across 2025 and into early 2026.
Stablecoin Usage Is Growing Faster Than Supply
The strongest structural signal in the report is that stablecoin usage is growing faster than stablecoin supply. Since January 2024, total supply roughly doubled, increasing about 100%. Over the same period, adjusted volume rose about 317%.
That divergence matters because it shows that each dollar of stablecoin supply is being used more frequently.
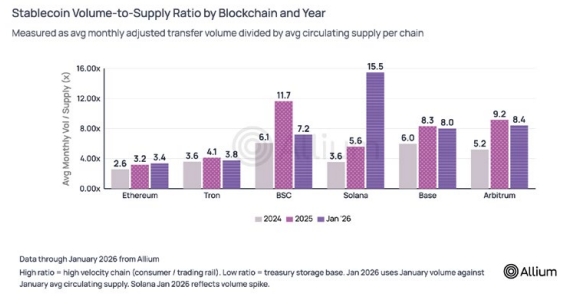
This is captured in the market’s rising velocity. Monthly stablecoin velocity, measured as adjusted volume divided by circulating supply, increased from about 2.6x to nearly 6x. In practical terms, stablecoins are turning over far more often than they did at the beginning of the period.
That is a sign of infrastructure maturity. In earlier market phases, supply growth tends to lead usage growth because assets are issued before there are enough practical channels to use them at scale. In a more mature phase, adoption broadens, the number of use cases increases, and transaction intensity rises faster than the asset base itself. That is exactly what the data suggest here.
The implication is straightforward. Stablecoins are not only being accumulated. They are increasingly being used in workflows that resemble real financial infrastructure, including commercial transfers, treasury operations, retail payments, and recurring transactional activity.
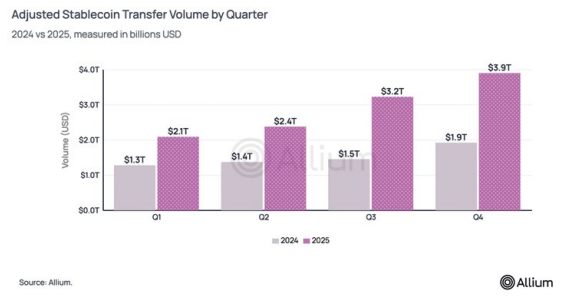
Stablecoin Payment Volume Reached A New Scale
The report’s payment-specific data show that stablecoins are moving beyond broad onchain utility into a more visible payments phase. Labeled stablecoin payment volume reached $374.5 billion in 2025, up 76% from $213.3 billion in 2024.
January 2026 alone recorded $44.7 billion in payment volume.
Payment transaction count rose even faster than payment volume. The number of labeled payment transactions reached 1.1 billion in 2025, up 107% year over year. When transaction count grows faster than total value, it usually signals a market shifting toward more frequent usage rather than simply larger transfers.
The average payment ticket size declined from $402 to $342, down 15%. That trend supports the same interpretation. Stablecoins are increasingly being used for smaller, more practical payment activity rather than being concentrated in larger transfers only.
This is a crucial development. A market can become large without becoming useful. What the payment data show is a market that is growing in a way that looks more operational and less speculative.
Stablecoin payment activity appears to be broadening into workflows that matter for businesses, consumers, and payment providers.
Stablecoin Payment Use Cases Are Broadening
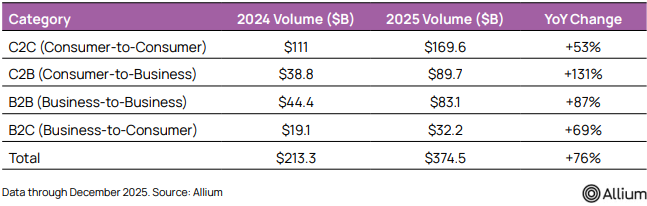
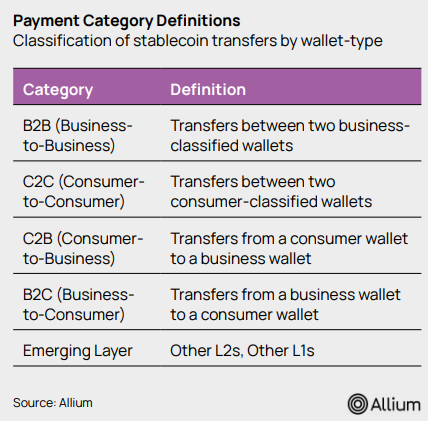
Stablecoin payments are not one category. The report breaks payment activity into four use cases: consumer-to-consumer, consumer-to-business, business-to-business, and business-to-consumer. That breakdown provides one of the clearest views into how stablecoin payments are changing.
- Consumer-to-consumer, or C2C, remained the largest single category. Payment volume in that segment rose from $111 billion in 2024 to $169.6 billion in 2025, a 53% increase. Even so, the most important growth came from business-linked segments.
- Consumer-to-business, or C2B, payments increased from $38.8 billion to $89.7 billion, a 131% gain.
- Business-to-business, or B2B, payments rose from $44.4 billion to $83.1 billion, up 87%.
- Business-to-consumer, or B2C, payments grew from $19.1 billion to $32.2 billion, up 69%.
Those figures point to a market moving beyond peer-to-peer transfers. Stablecoins are increasingly appearing in purchases, subscriptions, merchant flows, invoicing, payroll-like disbursements, refunds, and business settlement. Combined business-related activity already represents a large share of total payment value.
The transaction count data deepen that conclusion. C2B volume grew quickly while ticket sizes declined, which suggests more frequent, smaller purchases rather than occasional large transfers. That is one of the clearest signs of retail and merchant adoption.
The mix shift matters because it changes how the market should be valued. A stablecoin market centered mainly on peer transfers has one kind of ceiling. A market that expands into business payments, merchant activity, and operational finance has a much larger addressable opportunity.
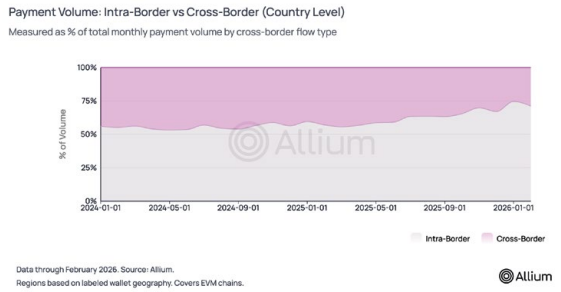
Domestic Stablecoin Payments Are Becoming More Important Than Cross-Border Narratives
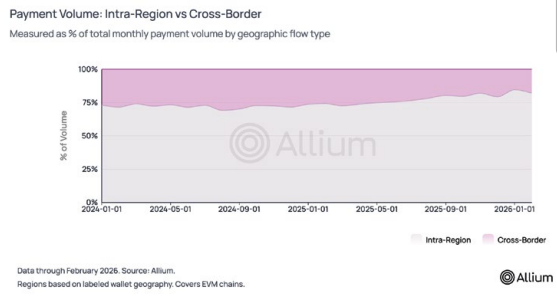
Stablecoins are often framed mainly as cross-border payment rails. Cross-border activity is clearly still important, but the report suggests that the more important structural shift is happening inside regions and inside countries.
About 84% of stablecoin payment volume occurred within the same geographic region. Over the study period, cross-border share fell from 27% to 15.5% in the regional view. At the country level, cross-border transfers fell from 44% to 26% of payment volume.
That means stablecoins are increasingly being used for domestic and intra-regional activity. This is a major change in narrative. Rather than serving only as an international transfer tool, stablecoins are becoming embedded in local and regional commercial systems.
This shift expands the market opportunity. Remittances are important, but they are a narrower use case than domestic commerce, operational payouts, merchant payments, and internal business transfers. If stablecoins are becoming useful inside everyday financial systems, their long-term role is much larger than the older remittance story implied.
This also helps explain why payment ticket sizes are falling and transaction counts are rising. Those patterns are often associated with routine usage rather than occasional cross-border settlement.
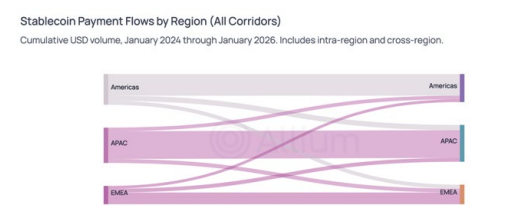
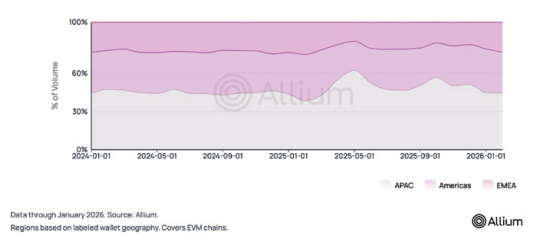
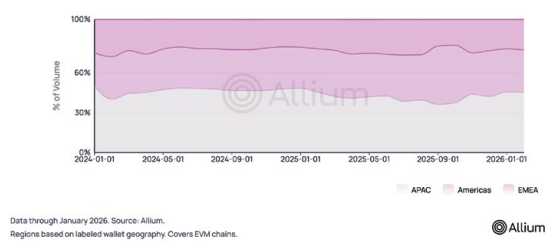
Geographic Flow Analysis: APAC Leads, But The Americas Are Gaining Share
Regional data show that the Asia-Pacific region remains the center of stablecoin payment activity. APAC accounted for 45% of stablecoin payment outflows and 45% of inflows.
That level of concentration reflects both the depth of digital asset activity in the region and the presence of payment-heavy use cases.
At the same time, the Americas gained noticeable share on the receiving side. The Americas’ share of inflows increased by roughly 7 percentage points since January 2024, reaching approximately 32% of receiving volume. That shift likely reflects stronger regulated on-ramp and off-ramp infrastructure, improving market access, and growing commercial use across the United States and Latin America.
The flow analysis also shows that stablecoin commerce is strongly regional. Large intra-regional flows dominate the network, which aligns with the domestic payments thesis. Even when cross-border activity is important, it often occurs within adjacent or closely connected markets rather than across unrelated geographies.
The country corridor data reinforce this point. The top payment corridors include both developed and emerging economies, and many of the largest patterns reflect strong economic ties rather than purely speculative crypto movement.
The US-Mexico corridor stands out, but it is not the only meaningful route. The broader message is that stablecoin payments are becoming part of regional financial activity, not merely global crypto circulation.
Stablecoin Holder Distribution Shows Broader Functional Adoption
Holder data provide another view into how the market is evolving. According to the labeled wallet analysis, approximately $159 billion of stablecoin holdings could be segmented by entity type.
Of that amount, exchange wallets held about $70.4 billion, consumer wallets held about $65.3 billion, and business wallets held about $21.2 billion.
Exchange wallets remain the largest category, which is expected because exchanges still act as important custody and liquidity hubs. But the consumer and business data are the more revealing part of the distribution.
Consumer holdings at this scale suggest that stablecoins are widely held beyond purely institutional or exchange settings. Business holdings, while smaller, indicate growing use in treasury, operations, working capital, and settlement.
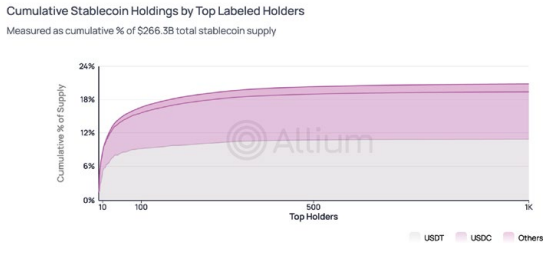
The concentration data add useful context. The top 1,000 labeled holders accounted for 21% of total stablecoin supply. That is meaningful concentration, but it is materially lower than concentration levels seen in many other crypto asset classes.
Taken together, these figures suggest that stablecoin ownership is broadening in function. The market is not simply a set of large centralized pools. It increasingly reflects a wider range of holders using stablecoins for different purposes.
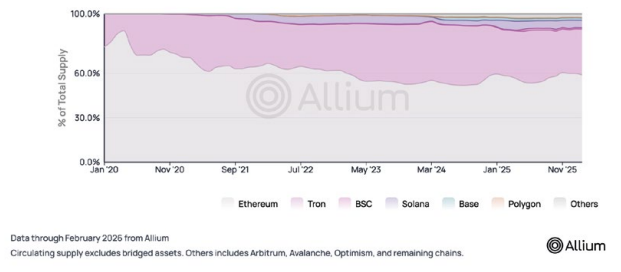
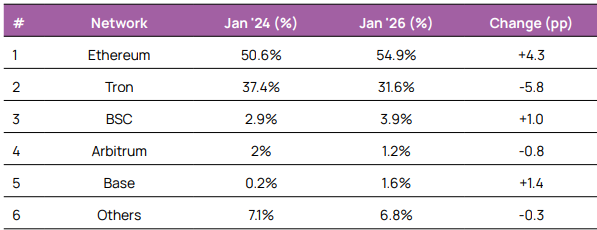
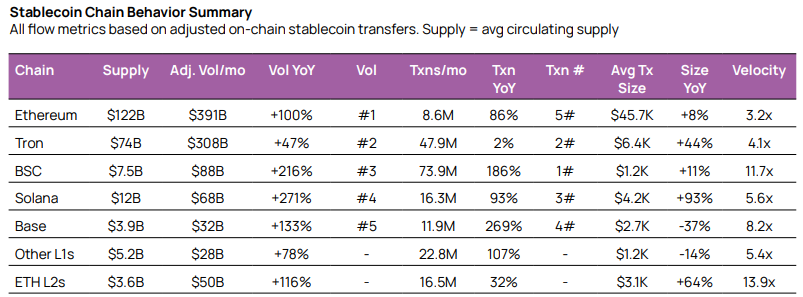
Ethereum And Tron Still Dominate Stablecoin Supply
Supply distribution remains highly concentrated. Ethereum hosted about 58.8% of total stablecoin supply as of February 2026, while Tron accounted for about 31%. Together, those two networks represented roughly 90% of stablecoin supply.
That concentration is not surprising. Ethereum remains the primary settlement layer for large-value transfers, institutional custody, and DeFi-linked usage. Tron continues to play a major role in stablecoin utility flows and mature user activity. Both chains benefit from established liquidity, broad support, and long-standing network effects.
However, the report also shows that supply dominance does not fully explain where activity is happening. Newer or smaller chains are gaining more importance in transactional usage than their share of supply alone would suggest.
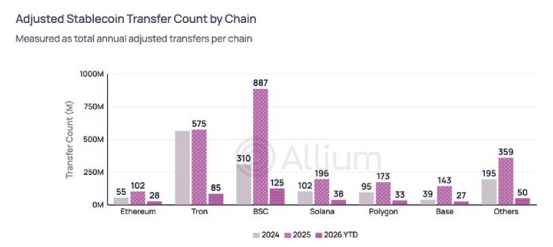
Solana, BSC, And Base Are Capturing More Transactional Activity
When the market is measured by adjusted volume and transfer count rather than just supply, the chain landscape looks very different. Ethereum and Tron still lead, but they no longer explain the full picture.
Solana showed one of the most dramatic gains. Its share of adjusted volume rose sharply from a very small base, and its transaction intensity expanded quickly. That suggests Solana is emerging as an important chain for higher-frequency stablecoin usage.
BSC stood out in transaction count. The chain processed a very high number of adjusted transfers relative to its share of supply, which suggests strong positioning in lower-value, higher-frequency activity.
Base also showed rapid growth, reinforcing the idea that newer networks can become important quickly when they fit the right user and application profile.
This split between supply share and activity share is one of the clearest signs that stablecoin infrastructure is becoming functionally differentiated. The market is not organizing around one chain doing everything equally well.
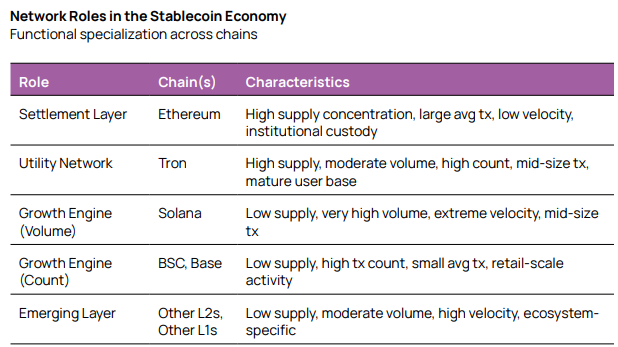
Stablecoin Infrastructure Is Becoming Multi-Chain And Functionally Specialized
The most useful way to interpret the chain data is through functional specialization. Different networks are serving different roles in the stablecoin economy.
- Ethereum increasingly looks like a settlement layer. It has the highest supply concentration, the largest average transaction size, and strong institutional relevance. The average transaction size on Ethereum was about $45.7 thousand, which supports the view that the network is heavily used for larger-value movement.
- Tron appears to operate as a utility network with very large supply, strong volume, and a mature user base. Its average transaction size of about $6.4 thousand places it well below Ethereum and points to more mid-sized commercial and operational flows.
- Solana looks like a growth engine for volume. It combines lower supply share with very high adjusted volume growth and strong velocity, suggesting that each unit of stablecoin on Solana turns over quickly. Its average transaction size of about $4.2 thousand places it between very low-value retail activity and larger settlement flows.
- BSC and Base look more like count-heavy, retail-oriented networks. BSC had a low average transaction size of around $1.2 thousand, while Base was around $2.7 thousand. Those profiles are consistent with frequent, smaller transactions, merchant activity, consumer flows, and app-driven usage.
Other layer-2 networks and smaller chains remain ecosystem-specific but still matter. They show that the market has room for more specialized roles beyond the largest chains.
The deeper point is that stablecoin infrastructure is not fragmenting randomly. It is specializing by use case. That is a sign of market maturity.
Strategic Implications For Fintechs, Payment Companies, And Investors
The data support a clear strategic conclusion. Stablecoins are transitioning from a speculative liquidity pool into a more functional layer of financial infrastructure.
For fintech builders, stablecoin support increasingly looks like a baseline capability rather than a niche feature. Applications should be chain-aware and chain-agnostic at the same time. No single network is likely to dominate every payment use case.
Builders should match the use case to the network’s strengths, whether that means low-cost retail payments, high-throughput transactions, large-value settlement, or emerging market distribution.
For payment companies and merchant networks, the rise of stablecoin payments suggests the emergence of a parallel rail rather than a temporary crypto side case. Payment growth is no longer explained only by speculative activity.
If stablecoins continue to move deeper into domestic and commercial usage, traditional payment providers will increasingly need infrastructure strategies rather than observation strategies.
For institutional investors, the key change is classification. Stablecoins increasingly resemble payment infrastructure, settlement infrastructure, and monetary utility rather than just crypto liquidity. Markets with rising velocity, expanding business use, and stronger domestic payment share look more like infrastructure adoption stories than trading stories.
For treasury teams and enterprise operators, the widening role of stablecoins across payroll-like payouts, business transfers, disbursements, and merchant-facing activity suggests that operational adoption may continue to expand faster than many forecasts assumed.
Risks And Limits
The growth pattern is compelling, but it should be interpreted with discipline. Several risks and limitations remain:
- Concentration is still meaningful: Stablecoin supply remains heavily dependent on a small number of issuers and a small number of chains. That creates systemic sensitivity if any major issuer or network faces disruption.
- Regulatory divergence remains another factor: Stablecoin frameworks are becoming clearer in some jurisdictions, but rules are still evolving across major markets. That may affect issuance, reserve design, compliance obligations, and distribution strategies.
- Labeling risk also matters: Parts of the payment and geography analysis rely on labeled wallet data and entity classification. That methodology is useful, but it is not perfect. Some transaction activity may still be misclassified or only partially attributed.
- Chain-specific anomalies should also be monitored: Extremely high velocity on some networks may reflect genuine commerce, but it can also reflect app-specific behavior, structural network effects, or temporary activity spikes.
- De-pegging risk is not zero: Stablecoins have shown greater resilience than in past cycles, but the possibility of severe stress events remains relevant for any infrastructure analysis.
Methodology And How To Read The Data
The report is built on proprietary onchain data infrastructure covering multiple blockchain networks in near real time. The analysis includes major chains such as Ethereum, Tron, BSC, Solana, Base, Arbitrum, Optimism, Polygon, Avalanche, and others.
A central feature of the methodology is the distinction between raw and adjusted volume. Raw volume includes all stablecoin transfers recorded onchain. Adjusted volume applies a series of filters to isolate more economically meaningful activity by removing entity-internal transfers, wash trading, and certain round-trip patterns.
Payment categorization is based on labeled wallet and entity types. That makes it possible to classify flows into consumer-to-consumer, consumer-to-business, business-to-business, and business-to-consumer categories.
Geographic analysis is based on tagged wallet regions and jurisdictions where data coverage is sufficient.
Methodology matters here because the report’s main conclusion does not depend on one metric alone. It appears repeatedly across supply, volume, transaction count, ticket size, geography, and chain behavior.
The same directional finding shows up from multiple angles:
Stablecoins are being used more broadly and more frequently as payment infrastructure.
Conclusion
Stablecoins in 2026 increasingly look like real payment infrastructure. The market is larger, but more importantly, it is more active, more distributed by use case, and more embedded in practical financial activity.
Supply reached approximately $266.3 billion, but usage grew faster than supply. Adjusted transfer volume climbed sharply, payment volume reached $374.5 billion in 2025, payment counts rose to 1.1 billion, and average ticket sizes declined. Those are the signs of a market moving toward more routine and more commercial use.
The geography data show that stablecoin activity is becoming increasingly domestic and intra-regional. The blockchain data show a market that is specializing by network role rather than converging into a single-chain structure. Ethereum and Tron remain foundational, but Solana, BSC, and Base are emerging as important transactional layers.
The most important takeaway is that stablecoins are no longer just growing. They are becoming more functional. That shift is what makes the 2026 market structurally different from earlier cycles.
Read Next:
- The Biggest Stablecoin Trends In 2026
- 9 Fastest-Growing Stablecoin Use Cases In 2026
- Top 10 Stablecoin Compliance Tools in 2026
FAQs:
1. What does it mean to say stablecoins are becoming payment infrastructure?
It means stablecoins are increasingly being used for recurring financial activity such as consumer payments, business transfers, merchant transactions, treasury movement, and operational settlement rather than mainly for crypto trading or passive holding.
2. Why is adjusted stablecoin volume more useful than raw volume?
Adjusted volume removes entity-internal transfers, wash trading, and round-trip activity, which makes it a better measure of economically meaningful usage.
3. Why does rising stablecoin velocity matter?
Rising velocity shows that each dollar of stablecoin supply is being used more frequently. That is an important sign that the market is becoming more active and more infrastructure-like.
4. Are stablecoins mainly used for cross-border payments?
Cross-border usage is still important, but the report suggests that domestic and intra-regional activity now represent the larger share of stablecoin payment flows.
5. Which blockchains are leading stablecoin activity in 2026?
Ethereum and Tron still dominate supply, but Solana, BSC, and Base are becoming more important in transaction-heavy and high-frequency stablecoin activity.
6. What is the main market conclusion from the report?
The main conclusion is that stablecoins are no longer only expanding in size. They are becoming more mature, more widely used, and more specialized as a form of payment infrastructure.
Disclaimer:
This content is provided for informational and educational purposes only and does not constitute financial, investment, legal, or tax advice; no material herein should be interpreted as a recommendation, endorsement, or solicitation to buy or sell any financial instrument, and readers should conduct their own independent research or consult a qualified professional.


