
Table of Contents
The stablecoin market closed out 2025 on a very strong note. We saw total market capitalization hit new highs, a trend largely fueled by clearer regulatory signals and a noticeable uptick in institutional interest. The key stablecoin stats q4 2025 paint a clear picture: a market cap cresting $290 billion and a major surge in on-chain transaction volume.
Q4 2025 Stablecoin Market Quick Reference Guide
This section is your high-level dashboard for the most important stablecoin statistics from the fourth quarter of 2025. Think of it as a cheat sheet to get a quick feel for the market's pulse before we dive deeper into the full analysis. The numbers point to a period of solid growth and wider adoption across the major blockchain networks.
By the end of the quarter, the total market cap for all stablecoins had pushed past the $290 billion mark. A big part of this was the growing regulatory clarity, particularly in the U.S., which gave larger players more confidence to enter the space.
This expansion wasn't just on paper; the actual circulating supply of stablecoins grew by about 16% in the last few months of 2025. That supply is spread across leading platforms like Ethereum, TRON, and Avalanche (AVAX), showing just how integrated these assets have become.
Key Performance Indicators
To give you an immediate overview, the table below highlights the most critical figures from Q4. These metrics provide a snapshot of market growth, on-chain activity, and where the action was happening. As you look over these numbers, you might also find our 2026 stablecoin market prediction a useful next step.
Here’s a quick summary of the key performance indicators for the stablecoin market in the fourth quarter of 2025.
Q4 2025 Stablecoin Market at a Glance
| Metric | Value (Q4 2025) | Quarter-over-Quarter Change |
|---|---|---|
| Total Market Capitalization | Over $290 Billion | +16% from Q3 2025 |
| Total On-Chain Volume | ~$8.5 Trillion | +21% from Q3 2025 |
| Most Active Blockchains | Ethereum, TRON, Solana | N/A (Categorical) |
The data here really confirms a bullish end to the year and sets a positive tone for what’s to come. The parallel growth in both market cap and transaction volume shows that stablecoins are cementing their place as a foundational layer of the digital asset economy—both as a dependable medium of exchange and a core pillar for DeFi.
A Look at Market Cap and Supply Dynamics
By the end of Q4 2025, the stablecoin market had ballooned to a valuation north of $290 billion. This wasn't just a number; it was a clear signal of serious capital inflow and growing confidence from across the financial spectrum. Stablecoins are increasingly becoming the bedrock for everything from DeFi protocols to everyday transactions in centralized finance.
If you're new to this space, having a firm grasp of understanding market capitalization is key. In simple terms, it’s the total dollar value of every stablecoin currently in circulation. Seeing this figure climb so steadily throughout the quarter tells us that demand is not only strong but persistent.
The infographic below puts the key growth drivers into perspective, breaking down the market cap, supply expansion, and the ever-widening blockchain footprint.
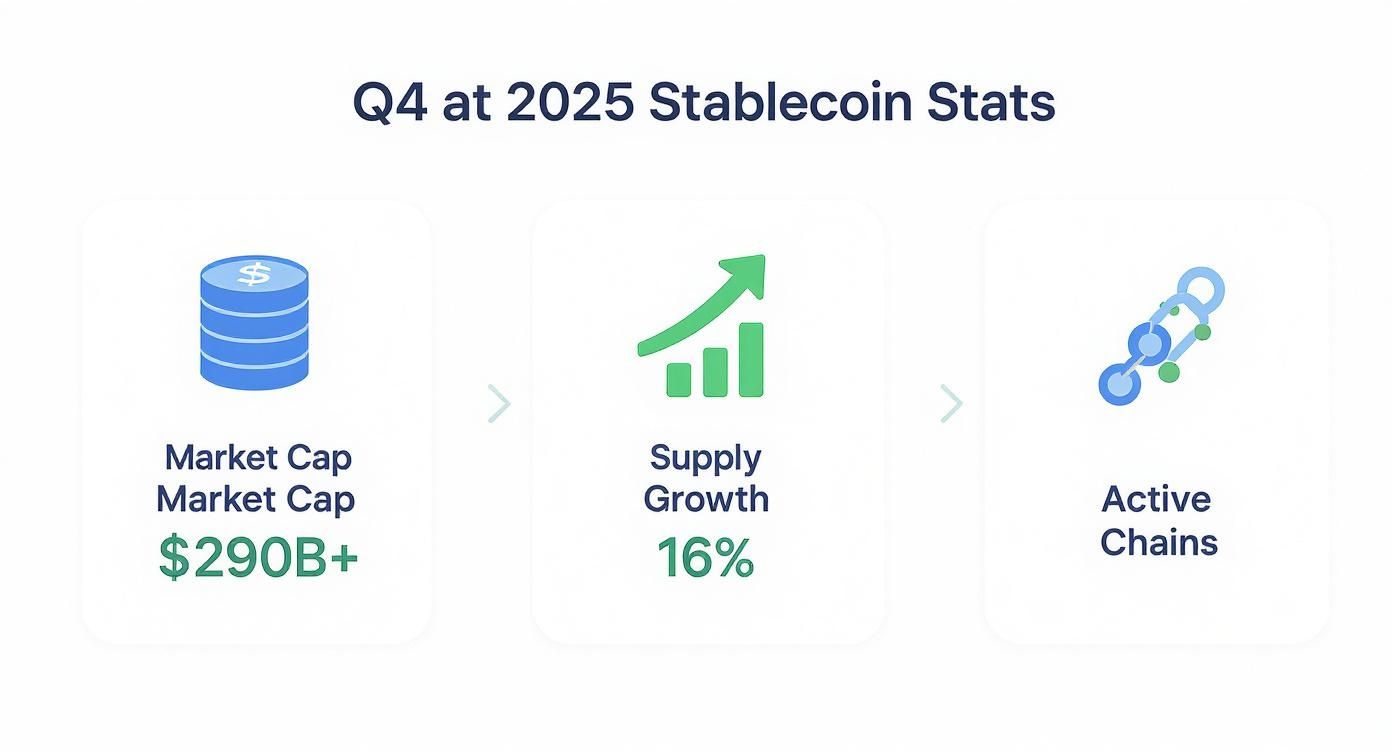
What we're seeing isn't just a bigger market. It's a more sophisticated one, with its tendrils reaching into new networks and powering more diverse applications.
Where the Supply Lives: Distribution Across Blockchains
Looking at where stablecoins are held tells a fascinating story about network usage and where developers are choosing to build. Ethereum is still the heavyweight champion, no doubt about it, but its dominance is being chipped away as other chains gain traction. We are firmly in a multi-chain world now; liquidity is no longer a one-network game.
A few key network shifts stood out in Q4 2025:
- TRON: This network really doubled down on its status as a go-to for USDT transfers. Its appeal is simple: low fees and fast transactions. For a deep dive on Tether's activity, our dedicated analysis is available here: https://stablecoininsider.org/usdt-november-2025-market-report/
- Solana: We saw a significant jump in stablecoin supply on Solana. This was fueled by its booming DeFi ecosystem and a real pull from institutional players who value its speed.
- Layer-2 Networks: Chains like Arbitrum and Optimism captured a larger slice of the pie. It's clear that users are actively looking for ways to sidestep Ethereum's high gas fees without leaving its ecosystem entirely.
This isn't random fragmentation. It's a sign of a maturing market where different networks are being chosen for specific jobs—whether it's for fast payments, high-frequency trading, or yield farming in DeFi.
Following the Money: Issuance and Redemption Flows
Issuance and redemption data gives us a raw, unfiltered look at capital flow and market sentiment. In Q4 2025, net issuance was firmly in the green, meaning far more new stablecoins were minted than were cashed out. This is a classic sign of fresh money pouring into the crypto ecosystem.
Think of it this way: issuances are the on-ramps for capital, and redemptions are the off-ramps. The pattern of net positive issuance we witnessed this quarter is a bullish indicator, plain and simple. It points to a growing trust in the peg and a broader demand for these assets.
While the titans like USDT and USDC accounted for the lion's share of new mints, we also saw a handful of emerging stablecoins add to the total supply. The field is getting more competitive, with newer players trying to carve out a niche by offering things like enhanced transparency or novel reserve models.
A Closer Look at On-Chain Transaction Volume and User Activity
Market cap tells you what's out there, but on-chain data shows you what's actually happening. It's the only way to get a transparent look at how stablecoins are being used in the wild, revealing the true economic pulse of the ecosystem. The stablecoin stats q4 2025 paint a clear picture: on-chain settlement is picking up serious speed, especially on the major networks.

The fourth quarter was a monster for Ethereum-based stablecoins, which put up some truly staggering settlement numbers. The total transfer volume for the quarter came in just shy of $6 trillion. To put that in perspective, that's a figure that rivals—and in some cases, surpasses—what we see from traditional payment giants like Visa or Mastercard.
This huge volume, which breaks down to about $85 billion in daily transfers, was fueled by a stablecoin supply that topped $180 billion. Of course, this wouldn't have been possible without layer-2 scaling solutions like Optimism and Arbitrum, which have become essential for managing transaction costs on the congested Ethereum mainnet.
How We Measure User Activity
Big volume numbers are impressive, but the real story is in the details. To understand who is moving all this value, we need to dig into specific user activity metrics. These data points tell us whether we're looking at large institutional settlements, small retail payments, or just a ton of trading activity.
We focus on three core metrics to get a clear picture:
- Daily Active Addresses (DAAs): This is a simple count of the unique blockchain addresses sending or receiving a stablecoin each day. A rising DAA count is a strong signal of broader user adoption.
- Transaction Count: The raw number of transfers that took place. High transaction counts often point to widespread use for smaller, more frequent payments.
- Average Transaction Size: We get this by dividing the total volume by the transaction count. It’s a great way to distinguish between retail and institutional activity. A lower average size usually means more peer-to-peer or consumer spending is happening. You can find a deeper analysis in our complete stablecoin spending report.
In Q4 2025, the average stablecoin transaction size on Ethereum remained quite high. This tells us the network is still the go-to for large-value settlements and DeFi. By contrast, a network like TRON showed a much lower average transaction size, reinforcing its niche as a hub for retail-focused, cross-border payments.
The Growing Influence of Layer-2 Scaling
It's impossible to talk about stablecoin scalability without mentioning layer-2 (L2) networks. By handling transactions off the main Ethereum chain, solutions like Arbitrum and Optimism have dramatically lowered fees and boosted speeds. This has been a game-changer, making stablecoins far more practical for everyday use cases.
The on-chain data backs this up. Throughout Q4, we saw a growing slice of the total stablecoin transaction count coming from L2 networks. This migration is huge—it lets users tap into Ethereum's security without paying the high price, which in turn opens up the market for countless stablecoin-powered apps and payment systems. The continued expansion of these platforms is one of the most important trends to watch as we head into 2026.
Stablecoins: The Engine of Decentralized Finance
You can't talk about decentralized finance (DeFi) without talking about stablecoins. They're the indispensable plumbing of the entire system—the go-to unit of account, the primary medium of exchange, and a reliable store of value. Their stability provides the bedrock for nearly every on-chain activity you can think of, from swapping tokens on a DEX to complex borrowing and lending strategies. The stablecoin stats q4 2025 really drive home just how deeply integrated they've become.
Think about it: by the end of Q4, stablecoins made up over 70% of the Total Value Locked (TVL) in major lending protocols like Aave and Compound. That’s a staggering figure. It shows that stablecoins are the number one choice for collateral when people want to borrow, and the most trusted asset for lenders looking for a steady, predictable return.
This heavy reliance tells us something important. When you see capital pouring into stablecoin-denominated liquidity pools, it’s a strong signal of market confidence and growing demand for on-chain financial services. It's a real-time barometer for the health of DeFi.
Dominance in DEXs and Liquidity Pools
On decentralized exchanges, stablecoins are simply essential. They're one-half of the most heavily traded pairs—think ETH/USDC or SOL/USDT—providing the deep liquidity traders need to swap assets without getting hammered by slippage. In Q4 2025, we also saw huge volume in stablecoin-to-stablecoin pairs, which tells us they're being used heavily for arbitrage and as a safe haven for traders to park funds between volatile trades.
A few standout stats from the top DEXs in Q4 2025 paint a clear picture:
- Uniswap V3: You'd consistently find stablecoin pairs in the top five by daily trading volume. It wasn't uncommon to see them clearing a combined $500 million in daily activity.
- Curve Finance: As the go-to platform for stablecoin swaps, Curve held its ground with a TVL of over $15 billion in stable assets. This is what enables the low-slippage trades that the rest of the ecosystem relies on.
Ultimately, this deep liquidity is what allows other DeFi protocols to even exist. Stablecoins are the foundational layer everything else is built on.
Yield Generation and Lending Markets
Trading is just one piece of the puzzle. Stablecoins are at the very heart of yield generation. People supply their stablecoins to lending protocols or liquidity pools to earn interest and a cut of the trading fees, effectively creating decentralized money markets. In a way, the yields offered on these stablecoins have become the benchmark "risk-free" rate for the entire DeFi space.
In Q4 2025, for instance, the baseline yields for supplying USDC or USDT on Aave V3 were hovering between 3.5% and 5.2% APY. These rates move up and down based on borrowing demand and protocol incentives, but they offer a relatively stable return on capital.
These yield opportunities are a huge reason why people hold stablecoins in the first place. Instead of just letting their money sit, they can put it to work. For anyone looking to get serious about this, understanding the mechanics is key. You can learn more about how to use stablecoins for DeFi yield farming in our detailed guide. It's a clear sign that stablecoins have evolved from a simple payment tool into a truly productive financial asset.
Making Sense of Reserve Composition and Transparency Reports
The bedrock of any fiat-backed stablecoin is the quality and transparency of its reserves. After all, a stablecoin is only as stable as the assets backing it up. Digging into a reserve composition report is the only real way to understand the risk you're taking on when you hold a particular token. Looking at the stablecoin stats q4 2025, there's an undeniable shift towards higher-quality, more liquid assets—a clear reaction to past market meltdowns and the ever-watchful eye of regulators.
At its core, a stablecoin's reserve is the pool of assets the issuer holds to make good on its promise: that every single token can be redeemed for its pegged value, usually one dollar. But these reserves are far from uniform. They can range from ultra-safe, easily accessible cash to far riskier and more opaque investments. Knowing the difference is absolutely critical for judging how a stablecoin might hold up under pressure.

Different Types of Reserve Assets
Forget the idea of reserves being just piles of cash in a vault. A modern reserve portfolio is a strategic mix of financial instruments, each with its own risk-reward profile. Throughout Q4 2025, we saw the major issuers double down on their flight to safety, beefing up their holdings of the most reliable assets to maintain user trust.
Here's a look at what you'll typically find inside a reserve report:
- Cash and Cash Equivalents: This is the most liquid and straightforward category, covering actual cash and deposits held at banks and other financial institutions.
- U.S. Treasury Bills (T-Bills): These are short-term government securities and are widely considered one of the safest investments on the planet. A large allocation to T-Bills is a huge green flag. In Q4 2025, the top-tier stablecoins held over 75% of their reserves in cash and short-term U.S. government paper.
- Commercial Paper: This is a type of short-term, unsecured debt issued by corporations. It's a step up in risk from government debt, as it's dependent on the financial health of the issuing company.
- Other Assets: This is a catch-all category that can include everything from corporate bonds to municipal debt, or even other digital assets. Each adds its own unique layer of risk to the portfolio.
The overall quality of this mix directly determines how well an issuer can handle a sudden wave of redemptions, especially during a market panic. For a more detailed breakdown of this entire mechanism, our guide on how stablecoins work is a great place to start.
Reading Attestation and Transparency Reports
Transparency is more than just a marketing term; it's the foundation of trust in this space. Issuers offer a window into their reserves through attestation reports, which are usually put together by independent accounting firms. These documents serve as a third-party check, verifying that the issuer actually holds enough assets to cover all the stablecoins it has issued at a given moment.
A major theme in Q4 2025 was the push for greater transparency. We saw several large issuers begin publishing daily reserve reports, a significant upgrade from the old standard of monthly attestations. This near-real-time data gives everyone a much sharper picture of an issuer's financial footing.
When you're looking at these reports, pay close attention to both their frequency and their depth. A monthly report is the bare minimum; weekly or daily is far better. The level of detail matters, too. A report that just says "commercial paper" isn't very helpful. A great report will specify the credit ratings of the companies that issued that paper. That's the kind of granularity you need to truly understand the counterparty and credit risks you're exposed to.
Gauging Peg Stability and De-Pegging Events
A stablecoin is only as good as its peg.## Gauging Peg Stability and De-Pegging Events
A stablecoin is only as good as its peg. Its entire purpose is to hold a steady price, but in the real world, a perfect one-to-one peg is more of an ideal than a constant reality. Minor price wobbles are completely normal, and analyzing them gives us a fantastic window into a stablecoin's true reliability and how well its stabilization mechanics actually work. The stablecoin stats q4 2025 data revealed that the top dogs showed impressive resilience, but they weren't entirely without moments of pressure.
We typically measure these price shifts in basis points (bps), where one basis point is just 0.01%. So, for a dollar-pegged stablecoin, a price of $1.001 is a +10 bps deviation, while $0.998 is a -20 bps deviation. Throughout Q4 2025, major players like USDC and USDT mostly stuck within a tight +/- 15 bps range, which signals strong market confidence and plenty of liquidity to absorb shocks.
That said, nothing is completely bulletproof. The occasional minor de-pegging event serves as a valuable stress test, showing us exactly how quickly a stablecoin can pull itself back to its target price.
Common Causes of Peg Instability
Knowing why a peg slips is just as important as measuring how far it falls. These moments of market stress don't just happen out of nowhere; they're almost always kicked off by specific events that challenge an issuer's reserves and the market's trust.
Several key factors were behind the temporary wobbles we saw in Q4 2025:
- Sudden Liquidity Crises: Imagine a massive, out-of-the-blue sell order on a single exchange. It can momentarily overwhelm the buy-side liquidity, pushing the price down before arbitrage bots and traders have a chance to jump in and balance things out.
- Concerns Over Reserve Quality: FUD—fear, uncertainty, and doubt—is powerful. Even a whisper or rumor that a stablecoin's reserves aren't fully backed or are packed with risky assets can cause a mad dash for the exits, leading to a de-peg as everyone tries to sell at once.
- Extreme Market Volatility: In a major crypto market crash, stablecoins become the go-to safe haven. This flood of demand can actually push the price slightly above the peg until the issuer can mint more supply to satisfy everyone.
We saw a textbook example in Q4 2025 when a mid-tier stablecoin briefly slumped to $0.995 (-50 bps) after news circulated about the quality of its commercial paper holdings. The peg recovered within a few hours, but only after the issuer injected capital and arbitrageurs saw a clear profit opportunity.
This incident really puts a spotlight on the critical role of arbitrage. When a stablecoin dips below its peg, traders buy the discounted coin on exchanges and redeem it directly with the issuer for its full face value, pocketing the difference. This buying pressure is what helps drive the price back up. The reverse is also true: if a coin trades above its peg, traders mint new coins and sell them on the open market, increasing supply and bringing the price back down to earth. These market forces are the first line of defense in keeping a stablecoin stable.
The Two Sides of the Coin: Global Payments and Illicit Finance
Stablecoins have exploded in popularity, but their story is a classic case of dual use. On one hand, they’re being championed as the next step in fast, cheap global payments. On the other, their inherent speed and semi-private nature have made them a go-to tool for illicit finance, creating a real headache for regulators.
This isn't a new problem—emerging financial tech often walks this tightrope. But the sheer scale and borderless design of stablecoins crank up both the potential rewards and the risks. A look at the stablecoin stats for Q4 2025 really brings this split personality into focus, showing how the same assets are fueling legitimate trade while also greasing the wheels of illicit activity.
A New Engine for Legitimate Cross-Border Commerce
For anyone doing business internationally or living in an emerging economy, stablecoins are a game-changer. Instead of waiting days for a traditional bank wire to clear, they can settle cross-border payments in minutes. This cuts out expensive intermediary banks and the headaches of navigating volatile currency exchange rates, which is a massive driver of their real-world adoption.
The numbers speak for themselves. Between January and July 2025, stablecoins accounted for around 30% of all crypto transaction volume worldwide. That’s an incredible $4 trillion in transfers, representing an 83% jump from the same period in 2024. These figures point to a powerful, growing demand for a better way to move money around the globe. For a more detailed look, it's worth checking out the full crypto adoption report from TRM Labs.
The table below breaks down which specific stablecoins were the heavy hitters in terms of on-chain activity during the last quarter.
Top 5 Stablecoins by On-Chain Volume (Q4 2025)
The on-chain transaction volume is a powerful indicator of a stablecoin's utility and adoption. It reflects how much value is actually moving through the network, providing a clearer picture than market cap alone. Here's how the top contenders stacked up in Q4 2025.
| Stablecoin | Total On-Chain Volume (Q4 2025) | Dominant Blockchain(s) | Market Cap Rank |
|---|---|---|---|
| USDT | ~$4.2 Trillion | TRON, Ethereum | 1 |
| USDC | ~$2.8 Trillion | Ethereum, Solana | 2 |
| DAI | ~$0.6 Trillion | Ethereum | 3 |
| FDUSD | ~$0.4 Trillion | Ethereum, BNB Chain | 4 |
| TUSD | ~$0.2 Trillion | TRON | 5 |
As the data shows, Tether (USDT) continues to lead the pack by a significant margin, largely thanks to its deep integration across multiple blockchains, especially lower-cost networks like TRON. This multi-chain presence is key to its dominance in high-frequency, smaller-value transactions common in emerging markets.
The Dark Side: A Tool for Illicit Finance
For all their legitimate uses, the very features that make stablecoins so effective—speed, liquidity, and global reach—also make them attractive to bad actors. These same benefits can be used for sanctions evasion, fraud, and money laundering, which has put stablecoins directly in the crosshairs of financial watchdogs worldwide.
In the first quarter of 2025, stablecoins were involved in roughly 60% of all illicit cryptocurrency activity. While they make up about 30% of total transaction volume, their role in illicit finance is clearly disproportionate.
So, why the gap? It's because illicit actors value the same things legitimate users do: speed and efficiency. A scammer can use stablecoins to bounce funds between different wallets and across multiple countries in minutes. This makes the money trail far more difficult to follow and recover compared to a traditional wire transfer, which is subject to numerous compliance checkpoints. It's a tough balancing act for authorities, who are left trying to foster financial innovation while shutting down these new avenues for crime.
Regulation Takes Center Stage in Q4 2025
If there was one story that defined the stablecoin market in the final months of 2025, it was regulation. Governments and financial watchdogs finally moved from talking points to tangible policies, and that shift proved to be a powerful catalyst.
This newfound clarity gave institutional players the confidence they needed to get off the sidelines. Rather than stifling the market, the new rules provided a predictable environment—exactly what large-scale, risk-averse capital needs to see before making a move. Looking at the stablecoin stats q4 2025, it's easy to see how market cap growth followed right on the heels of major policy announcements.
Key Legislative Milestones and Market Reactions
Of course, not all regulatory action had the same effect. Different approaches from different jurisdictions created unique market responses. Digging into these details is key to understanding where the market is headed and what challenges issuers might face next.
Several landmark developments from Q4 2025 really set the tone:
- New Issuer Licensing Frameworks: A handful of countries rolled out formal licensing requirements, forcing stablecoin issuers to meet standards similar to traditional payment companies. This was a massive step in legitimizing the space for mainstream finance.
- Stricter Reserve Mandates: Regulators doubled down on reserve quality, now mandating that major stablecoins back their supply with a high percentage of cash and short-term government debt. This move directly boosted investor trust and shored up peg stability across the market.
- Cross-Border Policy Alignment: We also saw more coordinated efforts between international regulators to harmonize their rulebooks. It's a critical step toward a more unified global market and helps cut down on companies jumping between jurisdictions to find the weakest rules.
The push for greater oversight is simply a sign of a maturing industry. While it adds compliance costs for issuers, the long-term payoff is a safer, more robust stablecoin ecosystem that can properly integrate with traditional finance.
When all was said and done, the regulatory story of Q4 2025 was about building a solid foundation. By setting clear rules of the road, policymakers unlocked a fresh wave of institutional adoption and prepared the market for its next phase of growth.
Q4 2025 Stablecoin Stats: Your Questions Answered
Got questions about the Q4 2025 stablecoin data? You're in the right place. This section breaks down some of the most common queries, giving you a quick reference to make sense of the key trends that closed out the year.
What Drove Stablecoin Market Cap Growth in Q4 2025?
The big story was regulatory clarity. With the market cap surging past $290 billion, the primary fuel was new confidence from institutional players. As major governments finally put firm rules on the books, a lot of the ambiguity that kept big money on the sidelines simply vanished.
This clarity created a far more stable and predictable environment for investment. The result was a direct line to new issuance, as institutional capital that was once hesitant began to flow into the market in a serious way.
Which Blockchain Processed the Most Stablecoin Volume?
It’s a tale of two networks. When it comes to sheer settlement value, Ethereum is still king. It handled nearly $6 trillion in on-chain volume this quarter, mostly because of its deep roots in DeFi where massive trades and liquidity movements are the norm.
But if you look at the number of transactions, TRON continues to dominate. Its low transaction fees and fast settlement make it the go-to for everyday payments and smaller cross-border transfers, especially in emerging markets. It has really carved out a niche for high-frequency, retail-level use.
How Q4 Volume Compares to Traditional Payments
The numbers are genuinely competitive now. The stablecoin stats Q4 2025 show that stablecoins are moving serious value. For example, stablecoins on Ethereum alone were settling around $85 billion per day.
To put that in perspective, that kind of daily throughput puts the network in the same league as payment giants like Visa or Mastercard. We’re witnessing a fundamental shift where stablecoins have grown from a crypto-niche asset into a full-blown parallel financial system.
What Do Q4 Statistics Suggest About Future Regulation?
The data points toward a future of integration, not conflict. The market's strong, positive reaction to the new regulatory frameworks in Q4 shows the industry is more than willing to work within clear rules. Expect regulators to double down on reserve quality and transparency audits.
We're likely heading toward a more mature, two-tiered market. One tier will consist of fully regulated stablecoins designed for institutional and mainstream finance, while the other will serve more specialized, crypto-native purposes.
For the latest news and deep-dive analysis on the stablecoin market, trust Stablecoin Insider. Stay informed with expert insights at https://stablecoininsider.com.


